Generic selectors
Exact matches only
Search in title
Search in content
Post Type Selectors

Popular stocks

Crypto

CFD

Currencies

Support

Gold

GOLD – Technical Analysis – 4h

October 10, 2025 16:03

Quick Summary

The chart for gold Futures reveals a dynamic price movement, characterized by a recent peak followed by a pullback. The asset’s performance has caught the interest of traders, influencing a noticeable rise in trading volume.

Key technical indicators suggest potential price stabilization around current levels, offering insight into future trends.

Candlestick Analysis

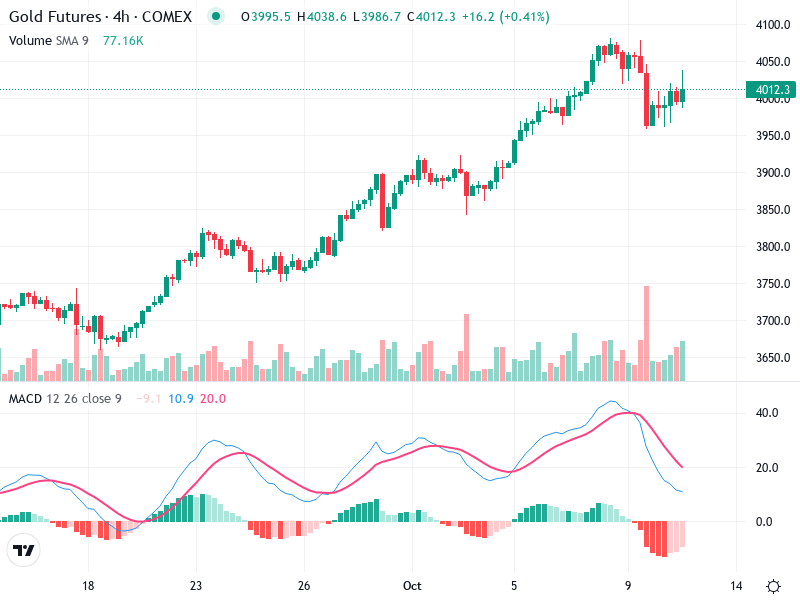
The chart shows a recent uptrend, followed by a slight pullback after reaching a peak.

There is evidence of a bullish engulfing pattern about midway through the chart indicating strong bullish sentiment.

Recently, after the peak, there are smaller body candles, suggesting indecision or potential consolidation.

MACD Analysis

The MACD line is below the signal line, indicating a bearish crossover which suggests a potential short-term decline.

The MACD histogram shows increasing bearish momentum, as it is currently negative and growing in size.

There’s no significant divergence between MACD and price action at the current state.

Volume Analysis

Noticeable increase in trading volume as the price peaked and started to pull back, indicating strong interest during this period.

The rise in volume during the pullback suggests active trading, which may stabilize the current price levels.

High volume spikes are apparent at the peak points, pointing to potential institutional activity.

Support & Resistance

Around 3950, where the price found recent support after the pullback.

The recent peak around 4050 acts as a new resistance zone.

Monitoring these levels is crucial for predicting future price movement.

Actionable Insights

Consider buying if the price holds above the 3950 support and MACD shows a bullish crossover.

If the price falls below the 3950 support, it could trigger further selling.

If the price consolidates between 3950 and 4050, a wait-and-see approach may be prudent.

The AI Technical Analysis Center is an informational tool only and does not constitute investment or trading advice.
This site is registered on wpml.org as a development site. Switch to a production site key to remove this banner.