Generic selectors
Exact matches only
Search in title
Search in content
Post Type Selectors

Popular stocks

Crypto

CFD

Currencies

Support

Gold

GOLD – Technical Analysis – 4h

October 16, 2025 16:03

Quick Summary

The chart of reveals a strong bullish trend with recent breakout patterns.

The asset shows positive momentum supported by volume increases, indicating institutional interest.

Candlestick Analysis

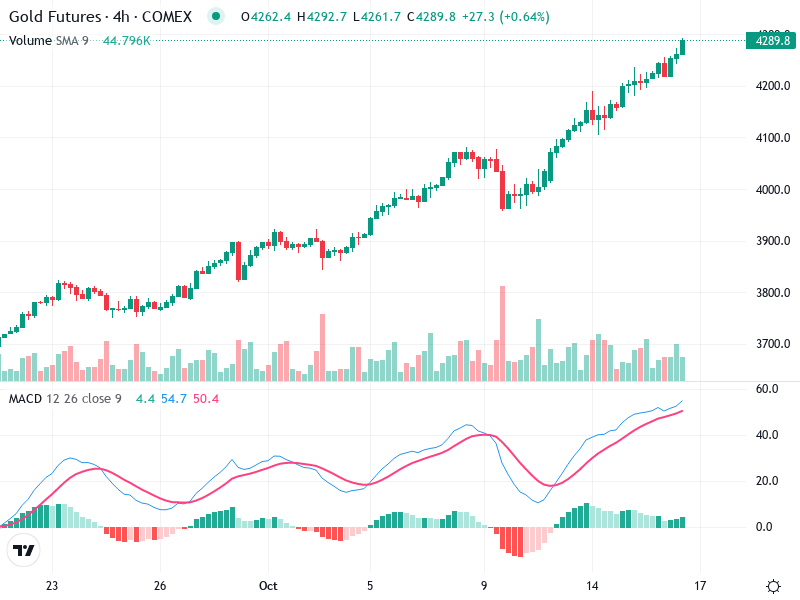
The overall trend is bullish, indicated by a series of higher highs and higher lows on the chart.

There are multiple bullish continuation patterns, such as consistent green candles, with no significant reversal patterns visible in the recent price action.

The chart shows a breakout above previous resistance around 4200, confirming bullish momentum.

MACD Analysis

The MACD line (blue) is above the signal line (red), indicating bullish momentum.

The histogram is positive and increasing, which supports the bullish momentum.

There do not appear to be any divergences between the MACD and the price movement currently, which reinforces the uptrend.

Volume Analysis

There is a noticeable increase in volume during recent upswings, particularly during the breakout above 4200.

This volume spike may indicate institutional buying, supporting the price uptrend.

No abnormal spikes in volume that contradict the price movement, suggesting a healthy uptrend.

Support & Resistance

The previous resistance was around 4200, which the price has broken through. This level may now act as support.

Current support can be noted around the 4100 level, where there was previous consolidation.

These levels are crucial for evaluating potential retracement zones or further breakout opportunities.

Actionable Insights

Consider buying on pullbacks to the breakout level around 4200, anticipating further upward momentum.

Watch for potential signs of reversal, such as bearish candlestick patterns or MACD crossovers.

Potential continuation of the uptrend, but be vigilant for any reversal signals, particularly if the price falls back below the 4200 support level.

The AI Technical Analysis Center is an informational tool only and does not constitute investment or trading advice.
This site is registered on wpml.org as a development site. Switch to a production site key to remove this banner.