October 29, 2025 17:02
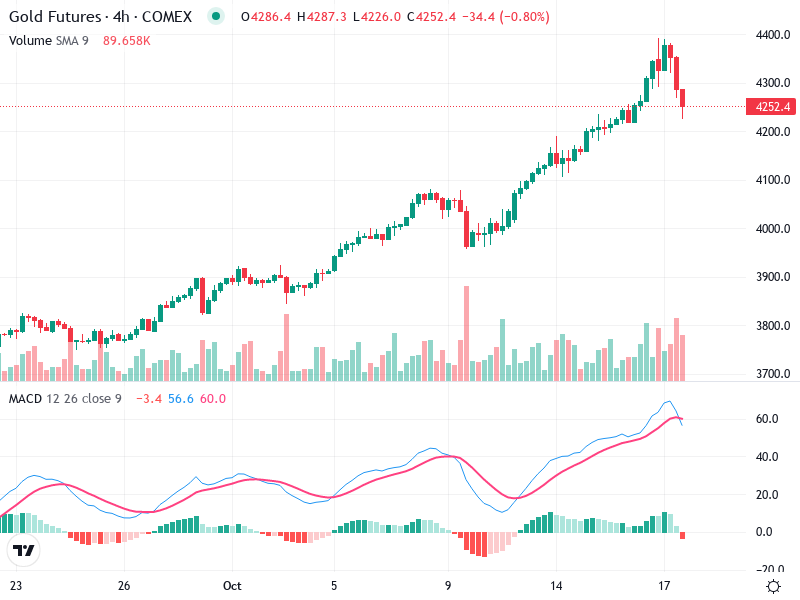
The gold Futures chart exhibits significant technical indicators suggesting a cautious outlook. Recent candlestick patterns, volume shifts, and MACD signals allude to potential bearish sentiment. The asset’s ability to hold above key support levels will be crucial in determining future price movements.
The chart shows a recent formation of bearish candlesticks indicating a potential reversal.
There is a notable red candle following several green candles, suggestive of a bearish engulfing pattern.
The recent trend has been bullish, but there is an emerging bearish sentiment indicated by the current pullback.
The MACD line is above the Signal line, but there is a bearish crossover forming.
This suggests a weakening bullish momentum.
The MACD histogram bars are turning negative, further supporting a potential decline in bullish momentum.
Increased volume is noted during the recent pullback, indicating potential distribution.
The rising volume with the price drop supports the bearish sentiment.
The volume spike suggests possible institutional selling or profit-taking activities.
Resistance level is near 4380.
Immediate support level around 4200.
A break below 4200 could lead to further declines, making these levels crucial.
Consider a cautious approach given the bearish signals.
Potential sell strategy if price continues to decline past support at 4200.
Hold or wait to observe for reversal signals or price stabilization before making new buy entries.