Generic selectors
Exact matches only
Search in title
Search in content
Post Type Selectors

Popular stocks

Crypto

CFD

Currencies

Support

Gold

GOLD – Technical Analysis – 4h

August 27, 2025 07:03

Quick Summary

The chart indicates a strong recovery after a significant dip.

Recent bullish patterns suggest potential for further gains.

Key resistance levels may shape near-term price action.

Candlestick Analysis

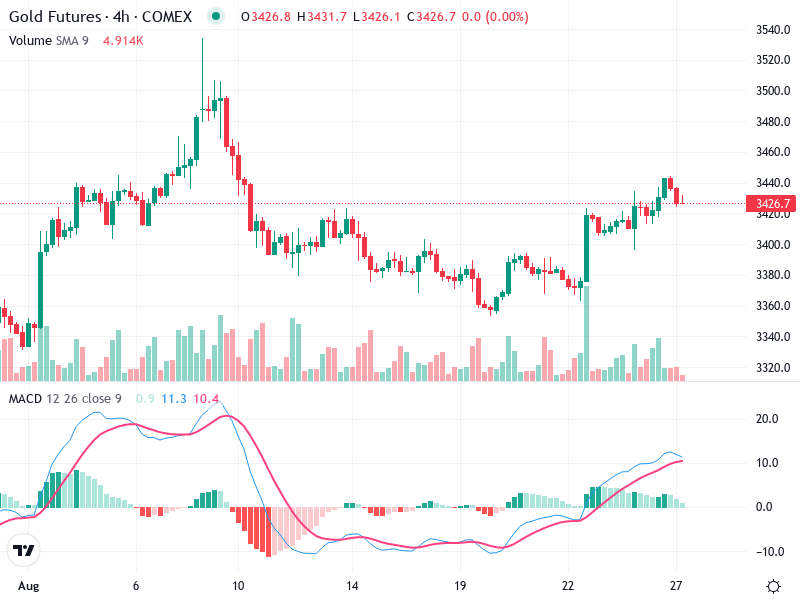
There is a noticeable bullish engulfing pattern around the August 22nd mark, which indicates a potential reversal from the previous downtrend.

A series of small-bodied candles follow, suggesting indecision or consolidation.

The overall trend appears bullish in the recent portion of the chart, following a significant dip and subsequent recovery.

MACD Analysis

The MACD line has recently crossed above the Signal line, indicating a bullish crossover.

Positive and increasing MACD histogram suggests building bullish momentum.

No significant divergences between the MACD and price action are apparent, supporting the current trend.

Volume Analysis

There was a substantial spike in volume during the bullish engulfing pattern, indicating strong buying interest.

The increased volume during price rises supports the bullish movement.

The volume spike suggests potential institutional buying during the reversal around August 22nd.

Support & Resistance

Key support appears to be around 3380-3400, where previous consolidation and reversal occurred.

The resistance zone is around 3430-3440.

A break above this could signal further bullish advances.

Actionable Insights

Buy on a confirmed breakout above the 3440 resistance, especially if supported by strong volume.

Hold if the price consolidates or shows indecision at current levels.

Watch for a potential pullback to the 3400 level for a potential entry point if the breakout fails.

The AI Technical Analysis Center is an informational tool only and does not constitute investment or trading advice.
This site is registered on wpml.org as a development site.