March 4, 2026 17:05 NGAS – Technical Analysis – 4h The Henry Hub Natural Gas Futures chart displays recent bearish activity, emphasizing a downward trend. A breakout below key levels suggests potential continuation of this…
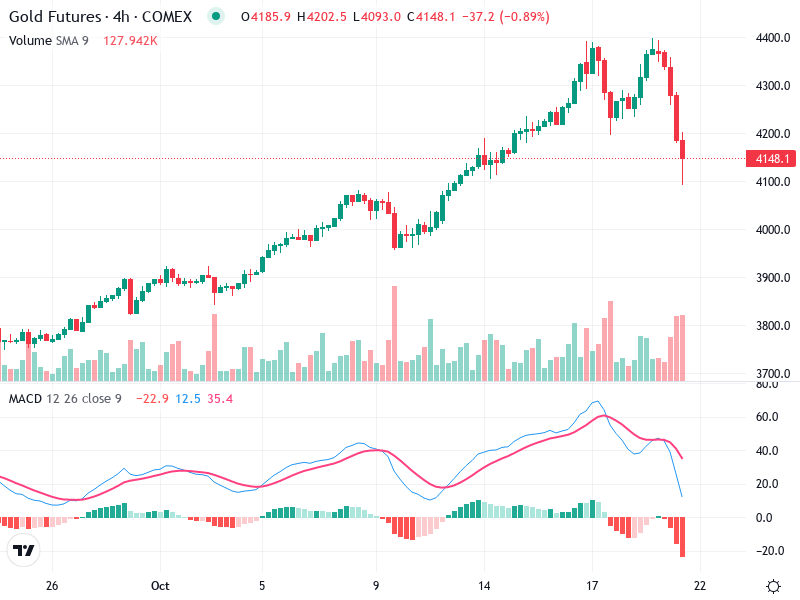
March 4, 2026 17:03 GOLD – Technical Analysis – 4h The chart highlights the recent price movements of the asset, indicating key levels of support and resistance. It reflects the ongoing trends and potential turning…
March 4, 2026 17:01 OIL – Technical Analysis – 4h The recent chart analysis for Crude Oil indicates significant movements. A strong upward movement was noted, followed by signs of consolidation. Key levels and patterns…