Generic selectors
Exact matches only
Search in title
Search in content
Post Type Selectors

Popular stocks

Crypto

CFD

Currencies

Support

Gold

GOLD – Technical Analysis – 4h

October 22, 2025 16:02

Quick Summary

The chart reflects recent significant movements, illustrating distinct bearish momentum. has undergone a shift in trend.

This analysis highlights potential levels of interest for traders and investors.

Candlestick Analysis

The chart shows a strong downward candlestick pattern following a noticeable uptrend. There are several bearish continuation patterns, such as long red candlesticks.

The trend has shifted from bullish to bearish, with a clear decline in price after the peak.

A significant breakout occurred below the 4100 level, initiating the downward momentum. Watch for potential pullbacks to this level.

MACD Analysis

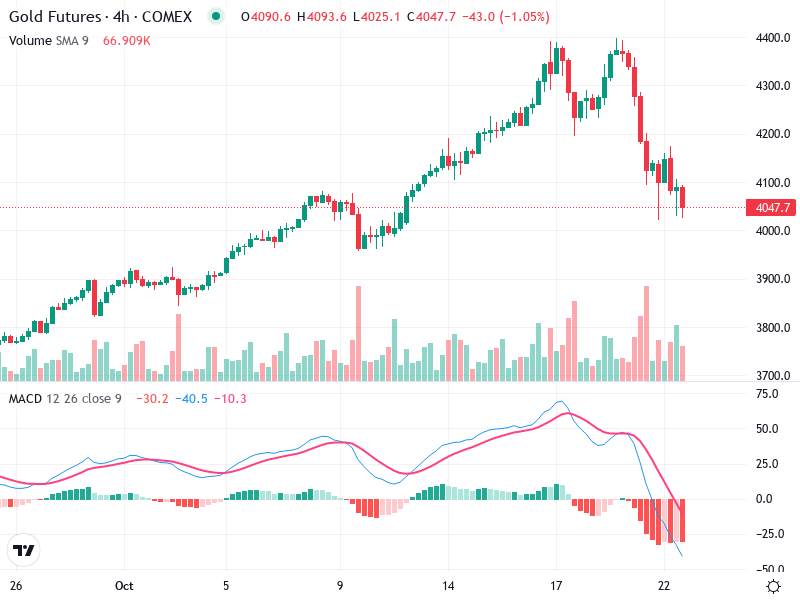
The MACD line is below the Signal line, indicating a bearish crossover, which suggests negative momentum.

The MACD histogram shows increasing red bars, implying a strengthening bearish momentum.

No significant divergence is visible between the MACD and the price action at this moment, confirming the price trend.

Volume Analysis

There is a noticeable increase in volume during the recent sell-off, supporting the downward price movement.

The volume spike suggests strong selling pressure, possibly indicating institutional activity.

The recent volume spikes during the fall may indicate a high level of conviction in the bearish movement.

Support & Resistance

A potential support zone is around the 4000 level, which is a psychological level and has been tested recently.

The immediate resistance is around the 4100 level, which the price broke down from.

If the price breaks below 4000, it could trigger further selling pressure.

Actionable Insights

Traders may consider selling or shorting if the price fails to recover above the 4100 resistance level.

Look for reversal signals, such as a bullish candlestick pattern at the 4000 support level, before buying.

Monitor for a bounce or confirmation of support at 4000. Watch closely for any reversal patterns.

The AI Technical Analysis Center is an informational tool only and does not constitute investment or trading advice.
This site is registered on wpml.org as a development site. Switch to a production site key to remove this banner.