Generic selectors
Exact matches only
Search in title
Search in content
Post Type Selectors

Popular stocks

Crypto

CFD

Currencies

Support

Gold

GOLD – Technical Analysis – 4h

October 23, 2025 16:02

Quick Summary

The gold Futures chart presently showcases significant market dynamics. A comprehensive look at key indicators suggests evolving trends, particularly around critical support and resistance zones.

The asset’s recent price movements point towards potential opportunities for traders, contingent upon further confirmatory signals.

Candlestick Analysis

The chart exhibits a bullish trend initially, followed by a bearish pullback.

A noticeable pattern is the formation of a potential 'hammer' near the recent low, suggesting a possible reversal.

Previous peaks near 4300 could represent resistance, where bearish candlesticks indicate selling pressure.

MACD Analysis

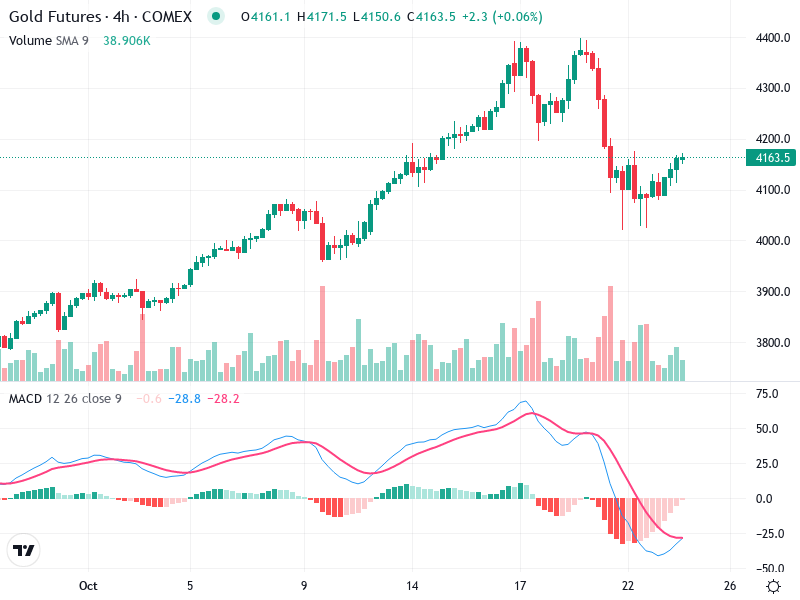
Currently, the MACD line is below the Signal line, indicating bearish momentum, but they are converging, which may signal a potential bullish crossover.

The histogram shows decreasing negative bars, suggesting a reduction in bearish momentum.

No clear divergence is visible, but the reduction in negative histogram bars aligns with recent price stabilization.

Volume Analysis

There are noticeable spikes in volume accompanying large downward movements, indicating strong selling pressure.

The increase in volume during the decline suggests that the downtrend may have been driven by institutional selling or panic.

High volume during the recent low could hint at accumulation by larger players.

Support & Resistance

Around 4100 appears to be a key support area where the price has recently held firm.

Resistance is evident near 4300, marked by previous attempts to rise that reversed sharply.

Maintaining above key psychological levels like 4000 would be crucial for sustained bullish sentiment.

Actionable Insights

Consider buying if the price confirms a reversal around 4100 with increased volume and a bullish MACD crossover.

Look to sell if the price fails to hold above 4100 or if bearish momentum increases with high volume.

Watch for the MACD to complete a bullish crossover and for a break above 4200 with rising volume as confirmation of renewed uptrend.

The AI Technical Analysis Center is an informational tool only and does not constitute investment or trading advice.
This site is registered on wpml.org as a development site. Switch to a production site key to remove this banner.