October 31, 2025 17:00
The chart indicates a potential shift in the trend for . Recent activity shows a mix of bearish and possible neutral patterns.
The asset has struggled to break significant resistance while maintaining key support levels, providing opportunities for strategic entries.
The overall trend exhibits a recent bearish movement, though a sideways shift is emerging.
Small-bodied candles suggest market indecision, hinting at a possible end to the bearish trend with potential doji or spinning top patterns.
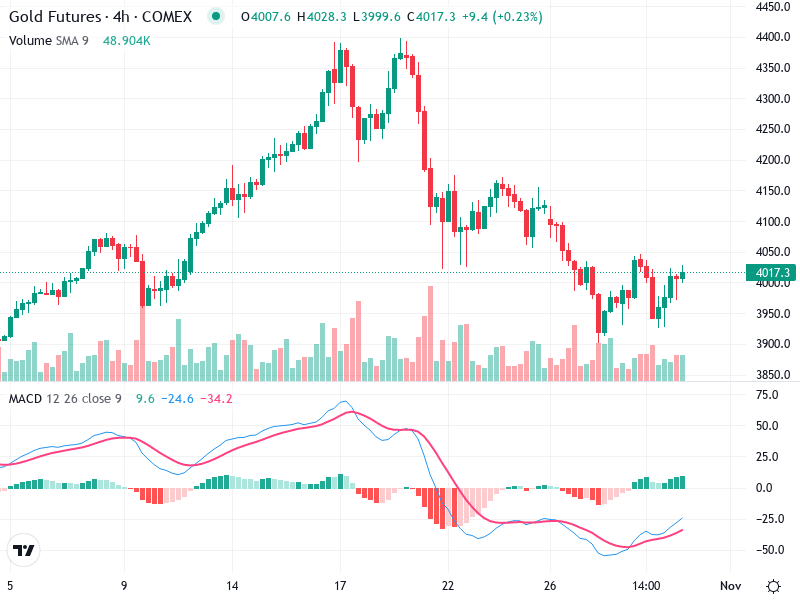
Current price action suggests resistance at 4050 and support at 3980, where price has held firm.
The MACD line's position above the Signal line indicates a recent bullish crossover but remains in negative territory, showing weak bullish momentum.
The growing positive MACD histogram bars suggest building upward momentum, albeit needing volume support for a stronger bullish confirmation.
No significant divergence between MACD and price action is observed.
Volume has slightly decreased, which conflicts with the positive MACD momentum, pointing to potential lack of strong buyer interest.
Volume spikes during recent downtrends may suggest institutional selling activity.
Monitoring volume changes is crucial for validating price action signals.
Resistance is seen around 4050, with multiple tests failing to break above.
Support is at 3980, functioning as a recent price floor crucial for any bullish reversal attempts.
Analysts should watch these levels closely for potential trading signals.
Consider buying if the price breaks and holds above the 4050 resistance, supported by an increase in volume.
Consider selling if the price breaks below the 3980 support level, especially with increasing volume to signal strong bearish intent.
If in a current position, await confirmation signals, such as strong volume movements, before making changes.