Generic selectors
Exact matches only
Search in title
Search in content
Post Type Selectors

Popular stocks

Crypto

CFD

Currencies

Support

Gold

GOLD – Technical Analysis – 4h

November 5, 2025 17:03

Quick Summary

The latest analysis of the gold Futures chart suggests a period of consolidation, marked by smaller candlesticks. While the market has demonstrated a recent bearish trend, the trend appears to be transitioning towards stabilization. Noteworthy support and resistance levels have been identified, which could play crucial roles in determining future price movements.

Candlestick Analysis

The recent formation shows signs of consolidation with smaller candlesticks, which could indicate indecision.

Prior to this, there are larger bearish candlesticks signaling downward momentum earlier in the trend.

The chart shows a transition from a strong bearish trend to a more sideways movement, suggesting potential stabilization or a base for reversal.

MACD Analysis

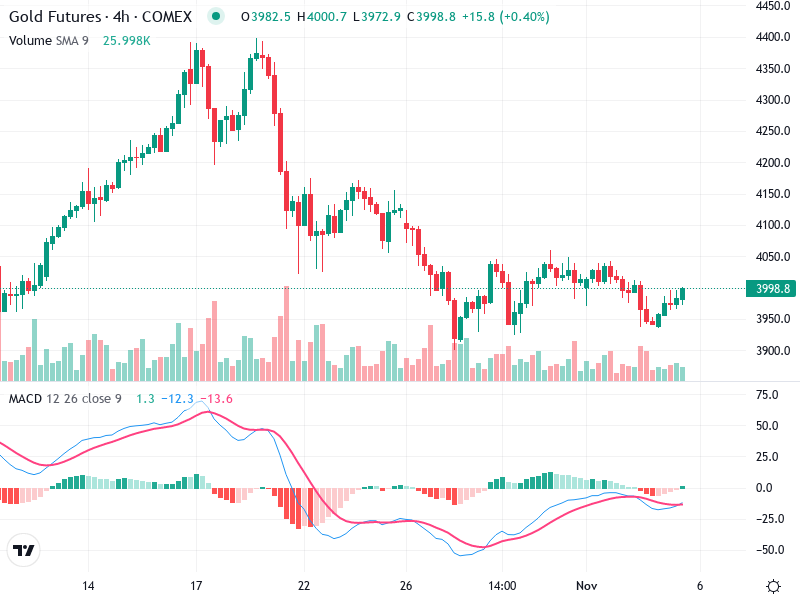
The MACD line is approaching the Signal line from below, indicating a potential bullish crossover.

The histogram is moving towards the zero line, which suggests waning bearish momentum and potential for bullish momentum if it crosses into positive territory.

There is no significant divergence between MACD and price action at this moment, indicating alignment with the current consolidation pattern.

Volume Analysis

There has been a notable decline in volume, consistent with the recent sideways trend, which typically precedes a significant price movement.

The decrease in volume during sideways movement suggests lack of strong buying or selling pressure.

No unusual volume spikes indicative of major institutional activity at present.

Support & Resistance

Support around 3970, which has held in recent price action.

Resistance at approximately 4050, where previous attempts to rise have been rejected.

These levels are crucial for traders; a breakout above resistance or a breakdown below support could signify new trend directions.

Actionable Insights

Consider entering long positions if the price breaks above 4050 with strong volume, confirming bullish sentiment and a potential trend reversal.

Short positions may be considered if the price breaks below 3970 with increasing bearish volume.

Current consolidation suggests a hold strategy until a clear breakout or breakdown is witnessed.

The AI Technical Analysis Center is an informational tool only and does not constitute investment or trading advice.
This site is registered on wpml.org as a development site.