Generic selectors
Exact matches only
Search in title
Search in content
Post Type Selectors

Popular stocks

Crypto

CFD

Currencies

Support

Gold

GOLD – Technical Analysis – 4h

November 6, 2025 17:02

Quick Summary

The gold Futures (4-hour chart) is demonstrating a technical landscape characterized by recent retracements and sideways patterns. The asset is performing within key resistance and support levels, with indications of potential reversals.

Investors should be mindful of the current momentum and volume trends that appear moderately bullish.

Candlestick Analysis

The current chart shows a bearish retracement from a recent uptrend, followed by a sideways pattern.

There's an earlier bullish engulfing pattern approximately on October 26th, indicating a potential reversal that led to a minor uptrend.

Recent candles show indecision with small bodies and longer wicks, suggesting potential for another reversal or continued sideways movement.

MACD Analysis

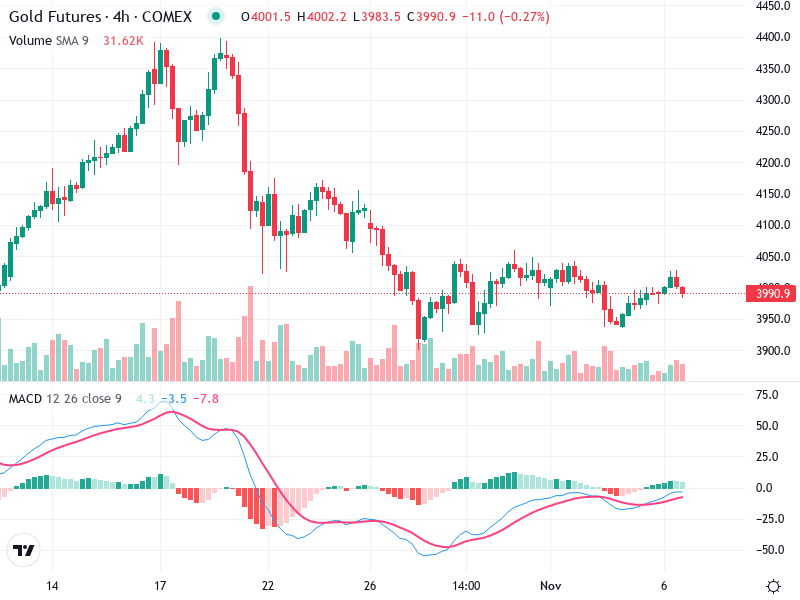
The MACD line is above the Signal line, depicting a recent bullish crossover. This suggests positive momentum, although the crossover is not strong.

The histogram shows positive but diminishing bars, indicating weakening bullish momentum.

No clear divergences are evident currently, aligning the MACD with price movement.

Volume Analysis

Volume was noticeably higher during the recent decline, indicating potential institutional selling.

The current rising situation sees volume tapering off, typically suggesting limited conviction in the bullish direction.

Watch for any spikes in volume for confirmation of direction, especially near resistance levels.

Support & Resistance

Key support is around 3980, which has been tested multiple times.

Immediate resistance lies at the 4050 level, where previous support turned resistance after the breakdown.

Actionable Insights

Consider buying if a clear breakout above 4050 is achieved with volume confirmation.

If price breaks below the 3980 support with increased volume, further downside is likely.

Given the current sideways movement, holding could be wise until a decisive move occurs.

The AI Technical Analysis Center is an informational tool only and does not constitute investment or trading advice.
This site is registered on wpml.org as a development site. Switch to a production site key to remove this banner.