Generic selectors
Exact matches only
Search in title
Search in content
Post Type Selectors

Popular stocks

Crypto

CFD

Currencies

Support

Gold

GOLD – Technical Analysis – 4h

November 10, 2025 17:02

Quick Summary

The gold Futures chart is showcasing a strong bullish trend. Recent price movements have broken past previous resistance levels, indicating a potential continuation of upward momentum. Investors are advised to watch for key levels and signals for investment strategies.

Candlestick Analysis

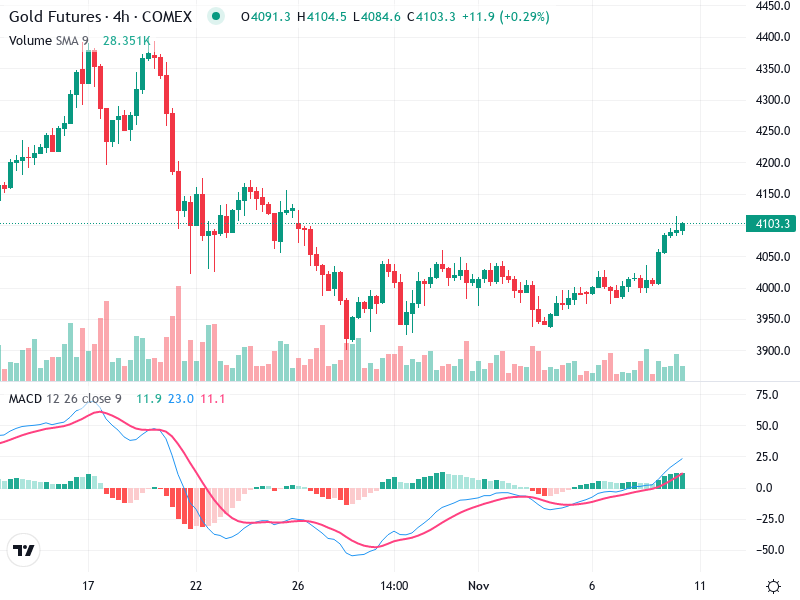
The chart shows a recent uptrend with a series of bullish candles overcoming previous consolidation, suggesting strengthening bullish sentiment.

The trend appears to be shifting from sideways to bullish, as indicated by the rising price action in the latter part of the chart.

There was a breakout above the 4080 level, which previously acted as resistance. Sustained movement above this level signals potential continuation of bullish momentum.

MACD Analysis

The MACD line (blue) has crossed above the Signal line (orange), indicating a bullish crossover.

The histogram is positive and increasing, suggesting building upward momentum.

There is no current divergence apparent between the MACD and price action, lending credibility to the recent upward movement.

Volume Analysis

Volume shows a notable increase during the breakout, confirming the price movement and suggesting strong buying interest.

The increase in volume supports the bullish breakout, indicating that the move is backed by significant market participation.

The volume spikes during recent sessions suggest potential institutional buying.

Support & Resistance

Key support is around the 4040 level, where consolidation occurred before the breakout.

The next major resistance to watch is around the 4150 level, which aligns with previous highs and may challenge further upward movement.

Actionable Insights

Consider buying if the price can maintain above the 4080 breakout level with continued volume support. Look for bullish continuation patterns.

Be cautious if the price falls back below the 4040 level with increasing bearish volume, which could signal a failed breakout.

Holding may be advisable if the price remains stable above 4080, with no signs of reversal.

The AI Technical Analysis Center is an informational tool only and does not constitute investment or trading advice.
This site is registered on wpml.org as a development site. Switch to a production site key to remove this banner.