Generic selectors
Exact matches only
Search in title
Search in content
Post Type Selectors

Popular stocks

Crypto

CFD

Currencies

Support

Gold

GOLD – Technical Analysis – 4h

November 11, 2025 17:02

Quick Summary

The asset’s chart has been showing a notable trend. Recently, price movements have indicated possible bullish patterns. Overall, the asset is exhibiting significant technical patterns worth analyzing.

Candlestick Analysis

The overall trend of the chart appears to be bullish recently, as indicated by the rising candlesticks after a period of consolidation.

There is a recent formation resembling a bullish continuation pattern, following a breakout from a prior sideways movement.

The breakout occurred around the 4050 level, suggesting this is a support zone now.

MACD Analysis

The MACD line is above the Signal line, indicating bullish momentum, though they appear to be converging which can suggest weakening momentum.

The histogram bars are reducing in size, indicating that the bullish momentum may be slowing down.

No significant divergence is presently observed between MACD and price action.

Volume Analysis

Volume has decreased overall after a spike during the breakout above 4050.

The initial breakout was supported by higher volume, lending credibility to the move.

Recent volume spikes correlate with price rise, which suggests participation by larger market players.

Support & Resistance

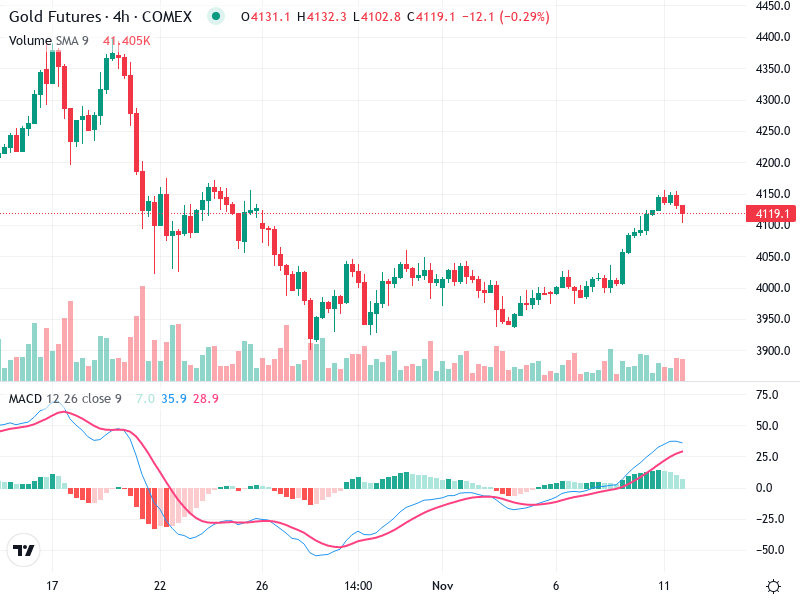
The levels around 4050, where the breakout occurred, act as strong support.

Immediate resistance is near the 4150-4170 range, where price is currently facing some selling pressure.

Overall, these levels are crucial for determining future price movements.

Actionable Insights

Consider buying near the support level of 4050 if price retraces, provided there is a bullish reversal signal.

Watching for bearish signals if the price fails to break above 4150-4170 with increasing volume could be an opportunity to sell.

Hold positions if the price consolidates above 4050 without breaking immediate support.

The AI Technical Analysis Center is an informational tool only and does not constitute investment or trading advice.
This site is registered on wpml.org as a development site. Switch to a production site key to remove this banner.