Generic selectors
Exact matches only
Search in title
Search in content
Post Type Selectors

Popular stocks

Crypto

CFD

Currencies

Support

Gold

GOLD – Technical Analysis – 4h

November 17, 2025 17:03

Quick Summary

The gold Futures chart reveals a recent bullish trend that peaked around the 4175 level before experiencing a pullback. The current analysis indicates some key levels and potential future movements for the asset.

gold remains a critical asset for traders and investors, influenced by various macroeconomic indicators.

Candlestick Analysis

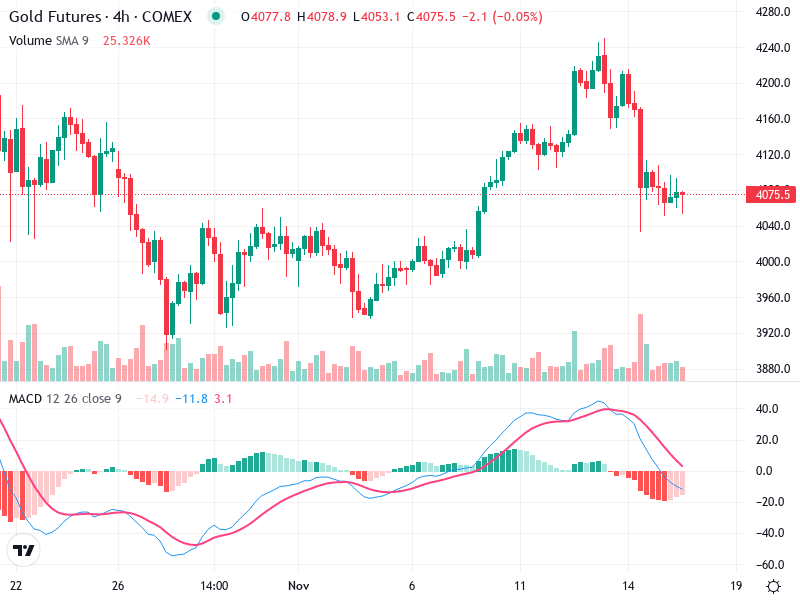
No clear major candlestick pattern (e.g., bullish engulfing or doji) is evident in the current sections, but recent bearish candles indicate some selling pressure.

The chart illustrates a recent bullish trend that peaked around the 4175 level, followed by a pullback.

The recent pullback appears to be stabilizing around the 4040 region, suggesting potential support.

MACD Analysis

The MACD line has recently crossed below the Signal line, indicating a bearish crossover.

The histogram is showing negative bars, reflecting bearish momentum but shows signs of contraction, suggesting weakening bearish momentum.

No notable divergence between MACD and price action at this time.

Volume Analysis

There was increased volume during the recent price drop, which supports the downward movement, showing potential liquidation or profit-taking.

The higher volume on down days suggests some institutional selling pressure.

No significant volume anomalies were observed, keeping focus on typical trading patterns.

Support & Resistance

The peak around 4175 serves as a key resistance level.

The 4040 level is currently acting as support. If this breaks, the next level to watch would be around 3960.

Watching these levels closely can provide further insights into possible price shifts.

Actionable Insights

Hold until further confirmation of trend direction (e.g., MACD histogram moving positive).

Consider buying on a strong bullish candlestick pattern at current support (around 4040) if accompanied by increased buying volume.

Watch for a break below 4040 for potential sell opportunity if confirmed by a bearish MACD signal.

The AI Technical Analysis Center is an informational tool only and does not constitute investment or trading advice.
This site is registered on wpml.org as a development site. Switch to a production site key to remove this banner.