Generic selectors
Exact matches only
Search in title
Search in content
Post Type Selectors

Popular stocks

Crypto

CFD

Currencies

Support

Gold

GOLD – Technical Analysis – 4h

November 18, 2025 17:03

Quick Summary

The analysis of gold Futures on the 4-hour chart suggests significant movements. The current technical indicators point towards a potential change in market direction. Observing key support and resistance levels is crucial for making informed trading decisions.

Candlestick Analysis

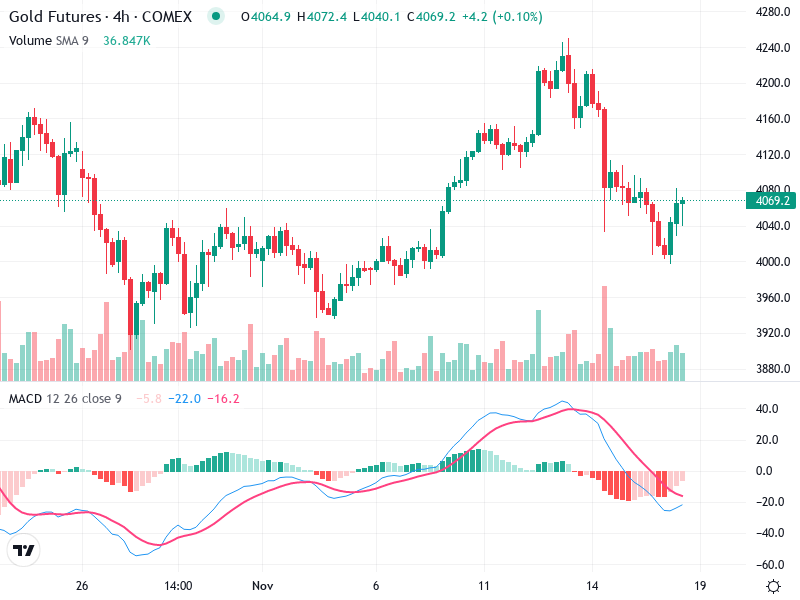
Towards the right, there is a potential bullish engulfing pattern forming, indicating a possible reversal or continuation of the short-term uptrend.

Earlier in the chart, observe a clear bearish trend with consecutive bearish candles, followed by a notable bullish candle indicating a possible turnaround.

The trend has been bearish leading up to this point but recently shows signs of recovery with bullish candles. Support around 4040 level, which previously acted as a resistance. A breakout above 4100 could signal a continuation upwards.

MACD Analysis

The MACD line is below the Signal line but shows a curling upward movement suggesting a potential bullish crossover might occur soon.

The histogram is negative but diminishing, indicating that the bearish momentum is weakening.

No prominent divergences visible at the moment. Keep watch if the MACD crosses above the signal line as price moves higher.

Volume Analysis

Noticeable increase in volume accompanying the latest upward price movement, suggesting strong buying interest.

The rising volume during price increase supports the bullish momentum, validating the recent bullish candles.

An unusual volume spike can be seen during the recent bullish push, which often suggests institutional activity.

Support & Resistance

Strong support is established around the 4040 level. Monitor this area for potential buying opportunities.

Resistance is observed near 4100 and then further at 4160. A breakthrough above these levels would denote strength and further upside potential.

Observing these levels can provide insights into possible future price directions and trading strategies.

Actionable Insights

Consider buying if a bullish crossover in MACD occurs and the price breaks above the 4100 level with strong volume.

If price fails to break above resistance levels and MACD fails to crossover bullishly, there might be opportunities to short considering resistance at 4100.

Traders already holding positions should watch for price behavior around the identified support and resistance zones.

The AI Technical Analysis Center is an informational tool only and does not constitute investment or trading advice.
This site is registered on wpml.org as a development site. Switch to a production site key to remove this banner.