Generic selectors
Exact matches only
Search in title
Search in content
Post Type Selectors

Popular stocks

Crypto

CFD

Currencies

Support

Gold

GOLD – Technical Analysis – 4h

November 19, 2025 17:03

Quick Summary

The chart indicates a recent shift in market sentiment, potentially impacting future movements.

Asset price movements suggest careful examination of support and resistance levels is necessary.

Candlestick Analysis

The recent candlesticks show a significant bearish engulfing pattern, which may indicate a potential reversal from the previous uptrend.

The trend appears bullish leading up to this pattern, with a potential pullback currently in progress.

The price recently tested the area around 4120 and pulled back, indicating a possible resistance zone.

MACD Analysis

The MACD line is below the Signal line, showing a recent bearish crossover, which implies a bearish sentiment.

The histogram has shifted from positive to negative, highlighting increased downward momentum.

There are no clear divergences at this point between price action and the MACD.

Volume Analysis

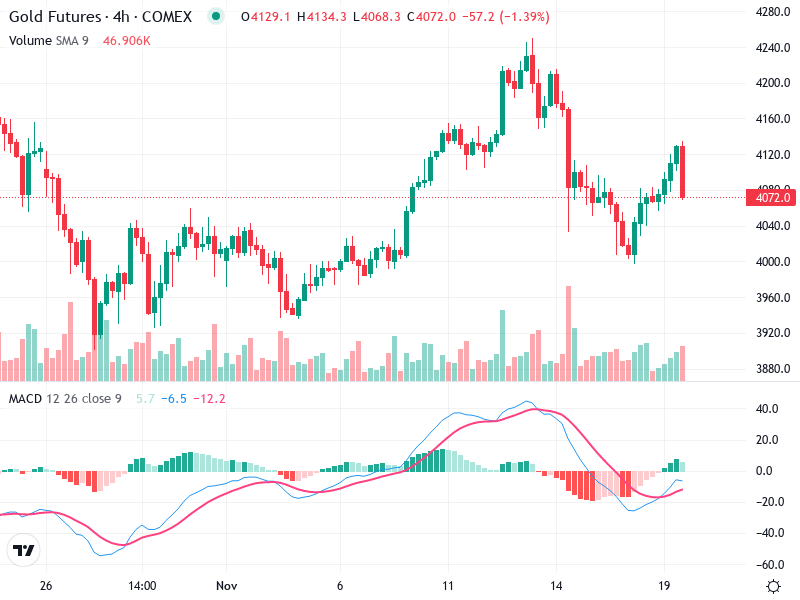
There’s a noticeable spike in volume alongside the bearish engulfing pattern, suggesting strong selling pressure, possibly indicating institutional activity.

The increased volume on the decline supports the bearish engulfing candle, adding credibility to the potential downward movement.

The volume dynamics highlight the importance of monitoring further price actions closely.

Support & Resistance

The area around 4120 is crucial, being a recent high before the pullback.

The zone near 4040 may act as immediate support. If broken, further decline could be expected towards the levels like 4000.

Watch for changes at key levels to assess ongoing market sentiment accurately.

Actionable Insights

Consider short positions if the price breaks below the support level of 4040 with continued volume.

Monitor for any bullish reversal signs before 4040, such as a bullish candlestick pattern or MACD crossover, if holding a long position.

Look for confirmation of the bearish sentiment or any reversal signs, especially around key support levels.

The AI Technical Analysis Center is an informational tool only and does not constitute investment or trading advice.
This site is registered on wpml.org as a development site. Switch to a production site key to remove this banner.