Generic selectors
Exact matches only
Search in title
Search in content
Post Type Selectors

Popular stocks

Crypto

CFD

Currencies

Support

Gold

GOLD – Technical Analysis – 4h

November 24, 2025 17:02

Quick Summary

The asset is showing signs of recovery as it attempts to establish a new uptrend.

Current technical indicators suggest potential bullish momentum.

Candlestick Analysis

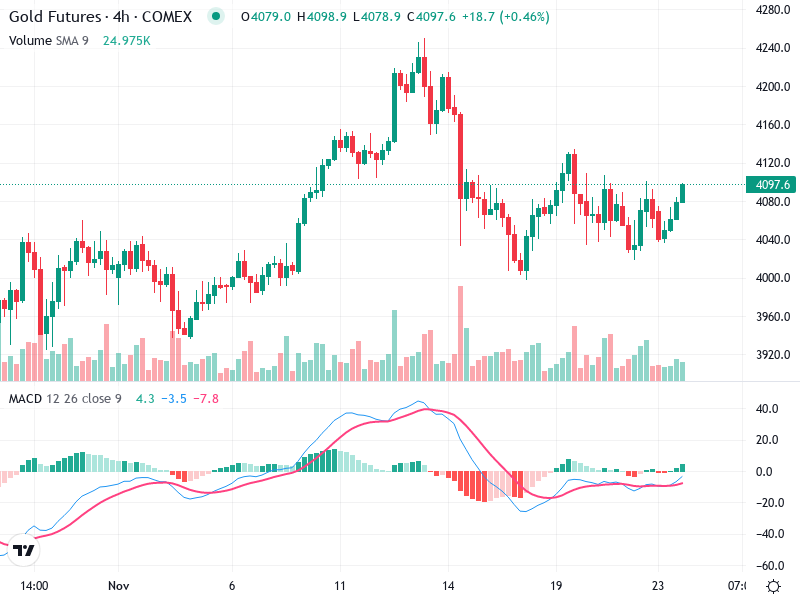
There doesn't appear to be any strong, classic candlestick patterns like a bullish engulfing or doji recently.

The trend seems to be forming a potential higher low, which could indicate a possible short-term uptrend.

Key breakout zone around 4120, aligning with previous resistance levels.

MACD Analysis

There's a recent bullish crossover of the MACD line over the Signal line, suggesting potential bullish momentum.

The MACD histogram is in positive territory, indicating increasing bullish momentum.

No significant divergences between MACD and price action at this time.

Volume Analysis

Volume has been relatively steady with no major spikes recently.

Volume does not strongly confirm the bullish move; a stronger volume would be ideal.

No unusual volume spikes observed recently.

Support & Resistance

Key support around 4040, acting as a recent floor.

Key resistance around 4120, if broken, could lead to further upside.

The asset is attempting to recover from previous declines and establish new uptrend levels.

Actionable Insights

Consider buying if the price breaks above 4120 with strong volume.

Watch for confirmation through continuation patterns or significant volume spikes.

Monitor for potential reversal signals if price struggles to break resistance.

The AI Technical Analysis Center is an informational tool only and does not constitute investment or trading advice.
This site is registered on wpml.org as a development site.