Generic selectors
Exact matches only
Search in title
Search in content
Post Type Selectors

Popular stocks

Crypto

CFD

Currencies

Support

Gold

GOLD – Technical Analysis – 4h

November 27, 2025 17:02

Quick Summary

The chart is currently displaying an optimistic outlook.

Recent trends suggest a continuation of upward momentum with some caution at resistance levels.

Candlestick Analysis

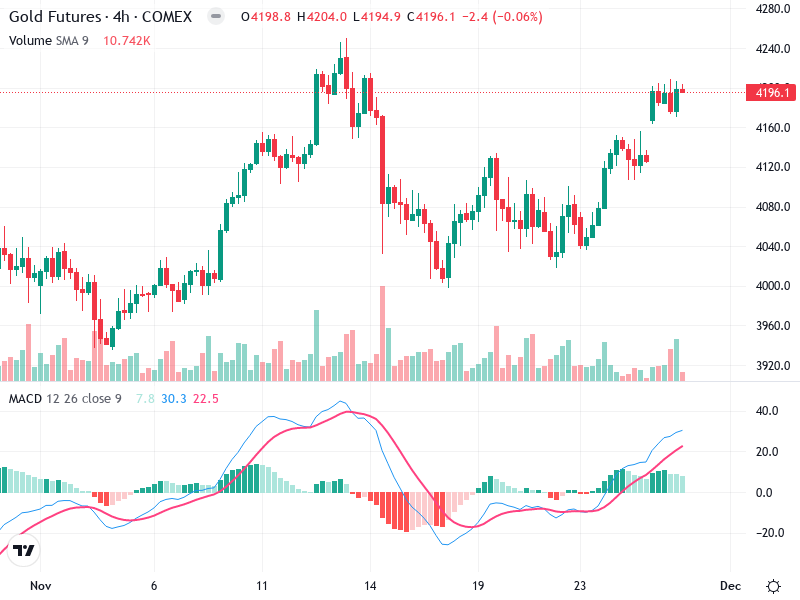
The overall trend is currently showing signs of recovery after a bearish phase, with a possible continuation of a bullish trend.

Around the middle of the chart, a bullish engulfing pattern appears, indicating a potential reversal from a previous downtrend. Recent candles suggest consolidation with a slight upward bias.

The price is approaching a resistance zone near 4200. A breakout above this level with volume might indicate further bullish potential.

MACD Analysis

The MACD line (blue) is above the Signal line (red), indicating a bullish crossover. This suggests positive momentum.

The histogram is positive and expanding, reinforcing the bullish sentiment.

No significant divergences noted between MACD and price action, suggesting alignment in bullish sentiment.

Volume Analysis

A notable volume increase correlates with the recent upward price movement, supporting the current bullish phase.

Volume tapered off slightly during consolidation, which is typical. Watch for volume spikes as potential momentum indicators.

No unusual spikes indicating institutional movements detected at the current stage.

Support & Resistance

Immediate resistance is at 4200. A clean break and hold above this level could open the path for further upside.

Key support is around 4080, where the price rebounded previously. This level should be watched for potential pullback support.

A breakout above resistance could signal further bullish potential.

Actionable Insights

Consider a buy strategy on a confirmed breakout above 4200 with adequate volume. A stop-loss near the 4080 zone may manage downside risk.

Monitor for strong signals from volume accompanied by price action for confirmation of breakouts. Be cautious of potential reversals if price fails to hold above resistance.

Sentiment appears cautiously bullish based on the MACD and volume trends.

The AI Technical Analysis Center is an informational tool only and does not constitute investment or trading advice.
This site is registered on wpml.org as a development site. Switch to a production site key to remove this banner.