September 5, 2025 07:09
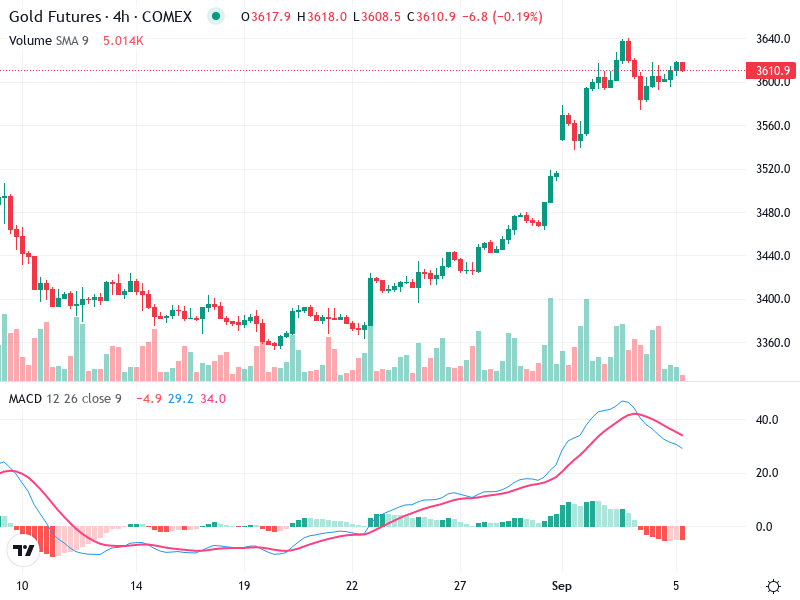
The gold Futures chart on a 4-hour timeframe shows a strong and consistent bullish trend.
Recent analysis indicates decisive buying interest with momentum supported by technical indicators.
The chart exhibits a clear bullish trend, characterized by a series of higher highs and higher lows.
No prominent reversal candlestick patterns such as dojis or hammers are visible in the current uptrend, suggesting strong bullish momentum.
Recent candlesticks display long bodies with minimal wicks, indicating decisive buying interest.
The MACD line is above the Signal line which suggests ongoing bullish momentum.
There is a sustained increase in the MACD histogram's bars, indicating strengthening momentum and confirming the uptrend.
Currently, no divergences are visible between MACD and price action, supporting the upward trend continuity.
Recent sessions show increased volume, particularly during upward price moves, which corroborates the strength of the bullish trend.
Volumes spikes align with price increases, suggesting possible institutional buying.
No significant volume drop is noted, maintaining the bullish scenario.
Immediate support is around 3460, the previous breakout point.
The chart currently does not indicate significant resistance until higher levels, further supporting an upward trajectory.
Monitoring any developments around support and resistance can provide actionable insights.
Consider buy positions with a potential target at higher Fibonacci retracement levels or psychological numbers, ensuring a trailing stop to protect gains.
Set stop-loss orders just below the breakout level of 3460 to mitigate potential pullbacks.
Watch for any signs of reversal or weakening volume that can suggest a shift in the trend.