

The technical analysis of gold Futures indicates a strong bullish trend on the 4H chart.
Key indicators suggest potential for upward continuation.
Traders should monitor market signals for confirmation.
The chart is currently showing a bullish trend, as evidenced by a series of higher highs and higher lows.
The recent large green candlestick suggests strong bullish momentum, potentially signaling a breakout from the recent sideways movement.
The price has broken above a resistance around 4280, indicating a potential upward continuation.
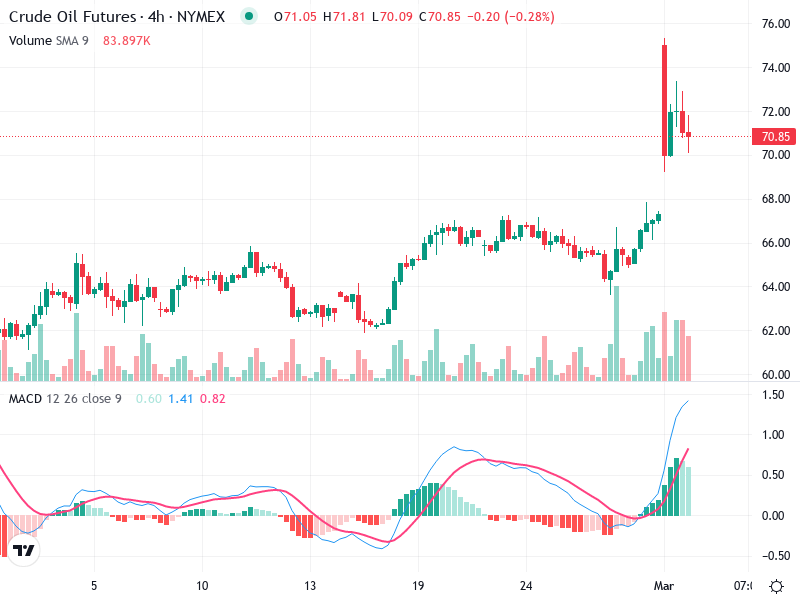
There is a bullish crossover, as the MACD line has crossed above the Signal line, suggesting positive momentum.
The histogram is increasing in the positive area, which confirms growing bullish momentum.
Currently, there are no observable divergences between MACD and price action, supporting the current upward movement.
There is a noticeable spike in volume accompanying the recent price increase, which validates the strength of the upward breakout.
The increased volume could indicate institutional participation, adding further credibility to the breakout.
These volume trends are enhancing the bullish sentiment.
Immediate support can be found around the 4280 level, previously a resistance now turned support.
The next resistance level appears to be around 4330.
A break and close above this could further affirm bullish continuation.
Considering the bullish breakout, traders may look to buy on pullbacks toward 4280 to 4300, with a stop loss just below the recent breakout level to manage risk.
Monitor for any bearish reversal signals near 4330 resistance for potential short opportunities.
Existing longs could be maintained with an eye on volume and MACD signals to confirm continued strength.