Generic selectors
Exact matches only
Search in title
Search in content
Post Type Selectors

Popular stocks

Crypto

CFD

Currencies

Support

Gold

GOLD – Technical Analysis – 4h

December 15, 2025 17:02

Quick Summary

The gold Futures chart is currently in focus, showcasing significant market movements. Recent trends and patterns offer insights into potential market directions. Understanding these dynamics can provide traders with actionable strategies for the near future.

Candlestick Analysis

The chart shows a recent bullish trend with prices moving upwards, but a slight pullback is visible towards the end.

There is a noticeable bearish candlestick pattern at the end of the chart, which may indicate a potential reversal or pullback in the short term.

The level around 4360 appears to be a recent high where a pullback started, suggesting a resistance level.

MACD Analysis

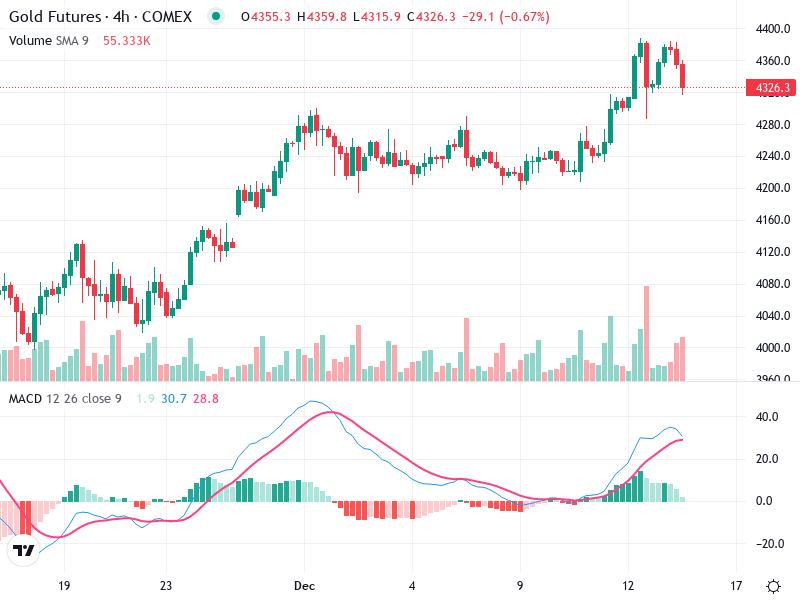
The MACD line is currently above the Signal line, implying bullish momentum.

The lines are starting to converge, which could potentially lead to a bearish crossover if the trend continues.

The histogram bars are declining, indicating a weakening bullish momentum, which aligns with the recent pullback in price.

Volume Analysis

There was an increase in volume during the recent price rise, supporting the bullish movement.

However, the current pullback also shows relatively high volume, signaling potential selling pressure.

No significant anomalies in volume spikes that suggest strong institutional activity outside of the normal trend amplification.

Support & Resistance

The 4360 level acts as a significant resistance, as seen from the recent price high followed by a pullback.

Around 4280 appears as a temporary support level, where prior consolidation happened before the rise.

Short-term sentiment appears cautious due to declining momentum and potential resistance challenges.

Actionable Insights

Potential buyers should consider waiting for confirmation of a reversal or support around 4280 before entering.

Traders holding long positions might consider taking profits, particularly if the price fails to break above 4360 again soon.

Current holders could maintain positions but should watch for changes in momentum, especially around support and resistance levels.

The AI Technical Analysis Center is an informational tool only and does not constitute investment or trading advice.
This site is registered on wpml.org as a development site. Switch to a production site key to remove this banner.