December 19, 2025 17:00
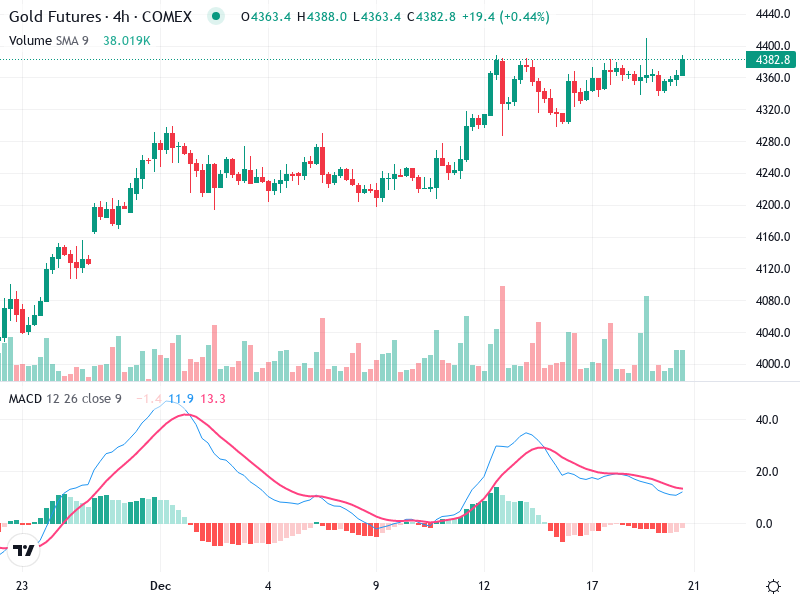
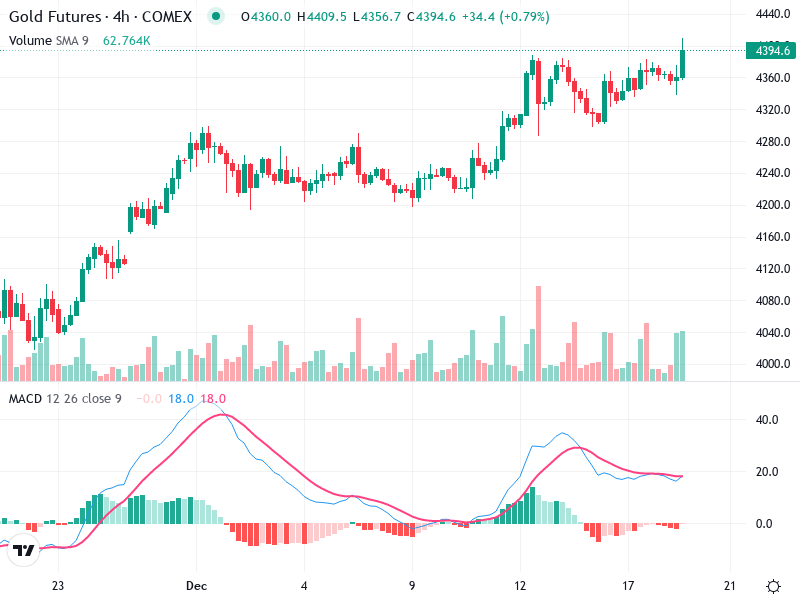
The gold Futures 4h chart is showing a steadily rising trend with significant buying pressure accumulating since early November. The price movement focuses on testing the 4400 resistance level, with volume and MACD confirming potential upward momentum.
Caution is advised as traders keep an eye on global economic indicators that could impact gold prices, maintaining a cautiously bullish sentiment.
Recent candlesticks show a mix of small-bodied candles with wicks, indicating indecision around the 4380 level.
Previously observed bullish patterns, such as bullish engulfing, pushed the price higher at the beginning of December.
The trend is currently bullish, evidenced by higher highs and higher lows since early December.
The MACD line is crossing above the Signal line, suggesting a bullish crossover indicating potential upward momentum.
The histogram is turning positive, reinforcing the bullish sentiment and suggesting increasing momentum.
No significant divergences between MACD and price action are noted currently.
Volume has been relatively stable, with notable spikes correlating with price increases, supporting bullish moves.
A recent volume increase aligns with the price's upward push, indicating strong buying interest.
Spikes in volume might suggest institutional activity, especially during breakouts around 4360 to 4380.
Support is strong around 4360, which served as previous resistance.
Potential resistance lies around 4400, where the price has shown some hesitation to break cleanly through.
The recent breakout level appears around 4360, where previous resistance seems to have turned into support.
Consider buying on a sustained breakout above 4400 with confirmation of volume increase.
Look for selling opportunities if there’s a bearish reversal pattern near 4400 or a breakdown below 4360.
For existing long positions, hold above 4360 and watch for further bullish confirmation.