Generic selectors
Exact matches only
Search in title
Search in content
Post Type Selectors

Popular stocks

Crypto

CFD

Currencies

Support

Gold

GOLD – Technical Analysis – 4h

January 2, 2026 17:03

Quick Summary

The gold Futures chart shows a mix of bullish and bearish movements over the displayed period. It highlights significant patterns and potential reversal zones, catering to traders looking to make informed decisions. This analysis aims to provide insights into the current momentum and key levels for gold Futures.

Candlestick Analysis

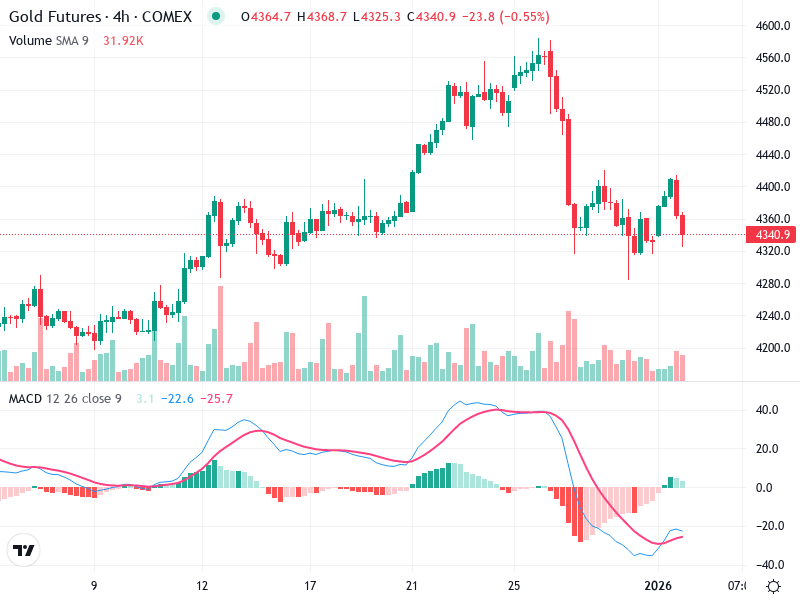
The chart initially exhibits a strong bullish trend with higher highs and higher lows, peaking midway through the period. However, there is a shift to a bearish trend with lower highs and lower lows subsequently observed.

A bearish engulfing pattern near the peak signals a reversal to a downtrend. Recently, a potential hammer pattern suggests a possible reversal from the downward movement.

A breakout at around 4460 was followed by a pullback, and the subsequent inability to reach prior highs confirms the bearish momentum.

MACD Analysis

The MACD line crossing below the Signal line indicates a bearish crossover, supporting the recent declines in price.

The histogram's negative values align with the bearish momentum, but shortening bars indicate decreasing momentum.

No significant divergences are currently observed between MACD and price action; however, the reducing negative histogram might suggest a slowing bearish trend.

Volume Analysis

A notable volume increase during the sell-off phase reinforces the downward price movement's strength.

The volume spike near the November price peak may indicate institutional profit-taking.

Overall volume trends suggest high market activity, particularly during significant trend changes.

Support & Resistance

Resistance near 4460 is marked by a previous high, serving as a key resistance level.

Support at around 4320 has been tested multiple times, indicating a strong interest area. A break below this level could signal further declines.

Critical support and resistance levels need monitoring for trend check and entry points.

Actionable Insights

Consider a buy strategy upon observing a bullish reversal pattern or a MACD bullish crossover before entering long positions.

Selling might be advantageous if the price breaks below the 4320 support with heightened volume.

If holding positions, placing stop-loss orders just below critical support levels or waiting for positive confirmation signals is advised.

The AI Technical Analysis Center is an informational tool only and does not constitute investment or trading advice.
This site is registered on wpml.org as a development site.