Generic selectors
Exact matches only
Search in title
Search in content
Post Type Selectors

Popular stocks

Crypto

CFD

Currencies

Support

Gold

GOLD – Technical Analysis – 4h

January 5, 2026 17:02

Quick Summary

The chart shows a recovering trend after a recent dip. Multiple bullish indicators suggest promising upward momentum.

Critical support and resistance levels are being tested, providing traders with key actionable insights.

Candlestick Analysis

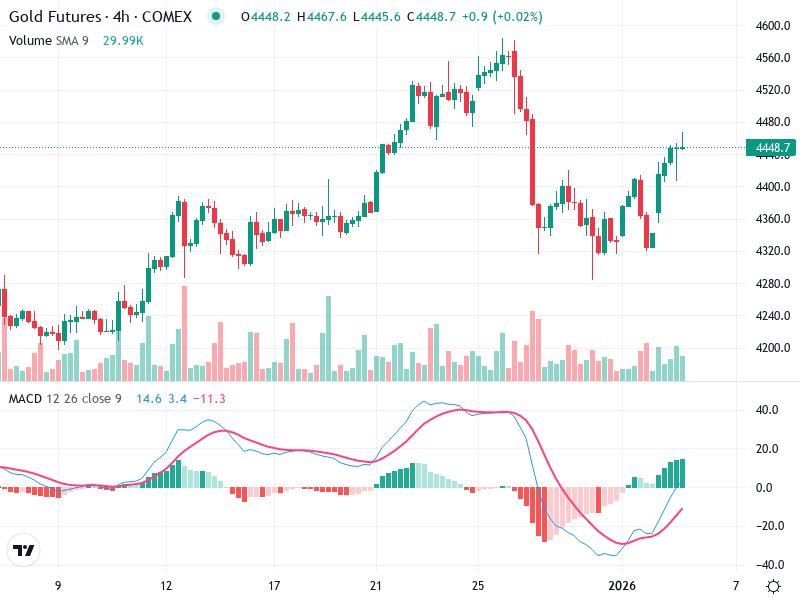
The overall trend appears to be bullish, with a recovery observed after a dip.

The recent recovery is marked by multiple consecutive bullish candles.

There is a prominent bullish engulfing pattern seen after the downtrend, suggesting a potential reversal.

MACD Analysis

The MACD line has crossed above the Signal line, indicating a bullish crossover.

The histogram shows increasing positive bars, reinforcing the bullish sentiment.

No significant divergence is observed; the MACD aligns with the current price action.

Volume Analysis

There is a noticeable increase in volume during the recent uptrend.

Unusual volume spikes coincide with the bullish candles.

These spikes suggest strong buying pressure, possibly indicating institutional activity.

Support & Resistance

Key support is identified around 4360, where the price found footing before the current upward move.

Immediate resistance is around 4460-4470, where the price is currently testing.

Actionable Insights

Consider buying if the price sustains above the 4460 resistance level.

Be cautious around the 4470 level if there is a rejection or loss of bullish momentum.

Watch for potential reversal signals near resistance levels or if the MACD shows waning momentum.

The AI Technical Analysis Center is an informational tool only and does not constitute investment or trading advice.
This site is registered on wpml.org as a development site. Switch to a production site key to remove this banner.