The asset exhibits a strong upward recovery on the chart. Notable technical patterns signal potential bullish reversals. Key levels of support and resistance are crucial for further direction.
Candlestick Analysis
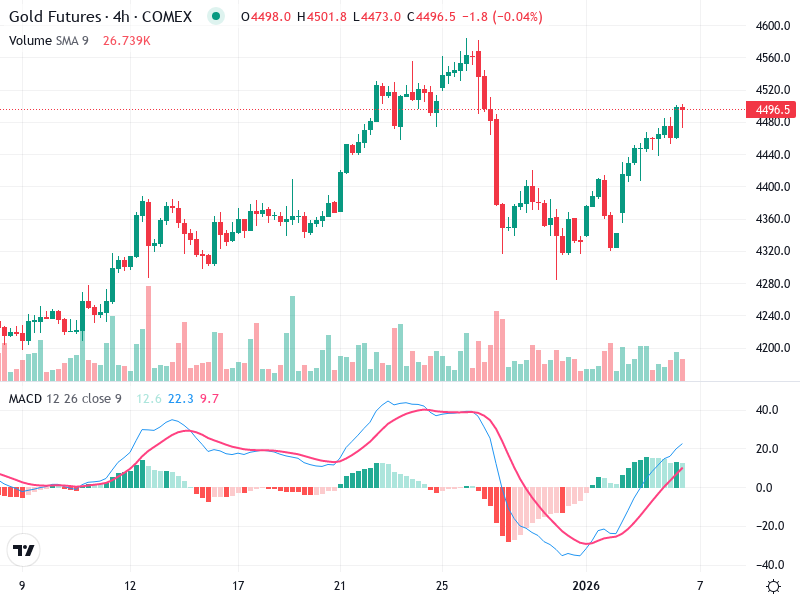
The chart shows an overall upward recovery following a significant pullback.
The recent candles indicate a bullish trend with some consolidation.
Patterns like the bullish engulfing signal potential bullish reversals.
MACD Analysis
The MACD line is above the Signal line, indicating bullish momentum.
A recent bullish crossover suggests a positive reversal.
No significant divergences are visible; the MACD supports the price action.
Volume Analysis
Recent increases in volume during the upward movement indicate strong buying interest.
The sharp spikes in volume during the recovery suggest institutional participation.
This is often indicative of a significant trend change.
Support & Resistance
Key support level is around 4370, where previous consolidation occurred.
Immediate resistance is around 4520, as seen from previous peaks.
These levels are crucial for determining potential future movements.
Actionable Insights
If price breaks above 4520 with strong volume, it could be a buy signal.
If already in a position, consider holding until it tests resistance or shows signs of reversal.
Watch for bearish patterns or MACD crossover if considering a sell.
The AI Technical Analysis Center is an informational tool only and does not constitute investment or trading advice.