Generic selectors
Exact matches only
Search in title
Search in content
Post Type Selectors

Popular stocks

Crypto

CFD

Currencies

Support

Gold

GOLD – Technical Analysis – 4h

September 3, 2025 07:03

Quick Summary

The chart exhibits a strong bullish trend with key indicators suggesting sustained upward momentum.

The breakout from consolidation is marked by significant price increases and volume spikes.

Technical indicators confirm the bullish sentiment, indicating potential for further price appreciation.

Candlestick Analysis

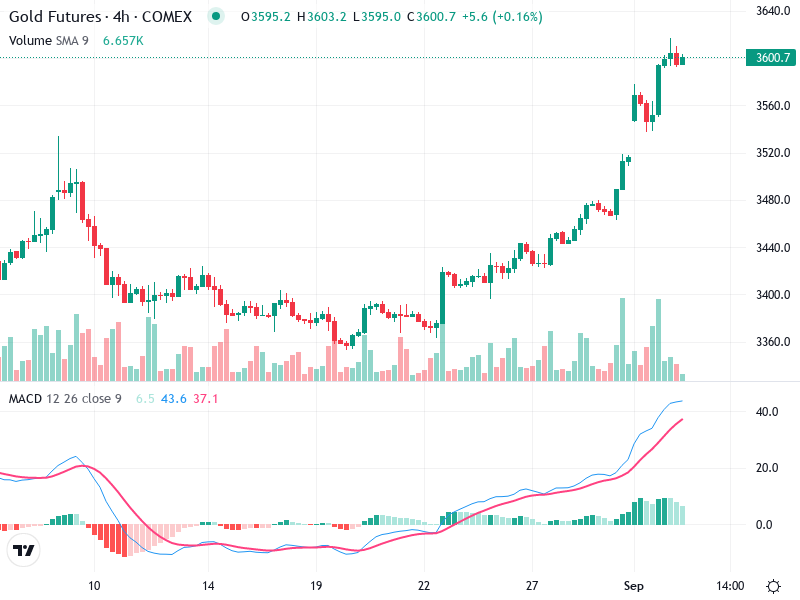
The chart shows a strong bullish trend with consecutive green candles, indicating sustained upward momentum.

There's a noticeable breakout from previous consolidation, visible around mid-August, leading to a significant upward movement toward the end of the month.

The overall trend is bullish, as evidenced by the series of higher highs and higher lows.

MACD Analysis

The MACD line is above the Signal line, indicating a bullish crossover that supports the upward trend.

The MACD histogram is expanding above the zero line, suggesting increasing bullish momentum.

Currently, there are no divergences; the MACD is in agreement with the bullish price action.

Volume Analysis

Volume increased considerably during the breakout period, confirming the strength behind the upward price movement.

Volume spikes coincide with price increases, reinforcing the bullish sentiment.

The rise in volume during the price breakout suggests possible institutional buying.

Support & Resistance

The 3420 level, where the recent breakout occurred, now acts as strong support.

Immediate resistance is near the 3620 level, where the price seems to be consolidating.

These levels are crucial for potential reversals; a break above 3620 could lead to further price appreciation.

Actionable Insights

Consider buying on pullbacks to support levels (around 3420) as long as the overall trend remains bullish.

Watch for signs of weakness near resistance at 3620, as a failure to break this level might indicate a potential reversal or consolidation.

Current holders could maintain positions while monitoring for any change in trend indicators or volume exhaustion.

The AI Technical Analysis Center is an informational tool only and does not constitute investment or trading advice.
This site is registered on wpml.org as a development site. Switch to a production site key to remove this banner.