Generic selectors
Exact matches only
Search in title
Search in content
Post Type Selectors

Popular stocks

Crypto

CFD

Currencies

Support

Gold

GOLD – Technical Analysis – 4h

January 8, 2026 17:03

Quick Summary

The gold Futures chart currently signals a potential reversal, marked by recent candlestick formations. Traders should keep an eye on key resistance levels for possible breakouts. With technical indicators hinting at a shift in momentum, strategic entries may be considered based on further confirmations.

Candlestick Analysis

A bullish engulfing pattern appears to be forming, suggesting a reversal from the prior downtrend.

The previous trend was bearish, evidenced by a series of red candles indicating selling pressure.

A potential breakout could occur above the 4475 level, where prior upward movements faced resistance.

MACD Analysis

The MACD line is nearing a crossover with the Signal line, indicating a possible bullish trend shift.

The MACD histogram is contracting in negative territory, suggesting weakening bearish momentum and a potential shift to bullishness.

No significant divergence is observed between the MACD and current price action.

Volume Analysis

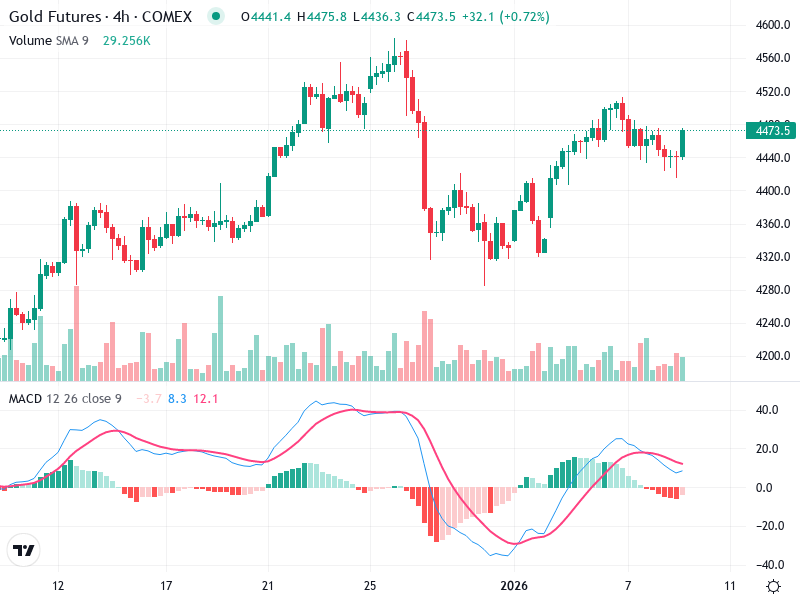
A noticeable rise in volume was observed during the bearish trend, indicating strong selling activity.

The recent bullish candlestick lacks a significant volume increase, signaling caution until more volume supports the move.

No unusual volume spikes, but increases should be monitored if resistance attempts continue.

Support & Resistance

Key support is around the 4400 level, where prices previously rebounded.

Key resistance is near the 4475 level, aligning with recent price peaks and the potential breakout point.

Watch for movement between these levels for trading opportunities.

Actionable Insights

Consider buying if the price breaks above the 4475 resistance with increased volume, anticipating further upwards movement.

Employ a stop-loss just below the recent support around 4400 to manage risk.

Watch for confirmation of a bullish MACD crossover and rising volume on upwards moves to validate a sustained trend reversal.

The AI Technical Analysis Center is an informational tool only and does not constitute investment or trading advice.
This site is registered on wpml.org as a development site. Switch to a production site key to remove this banner.