Generic selectors
Exact matches only
Search in title
Search in content
Post Type Selectors

Popular stocks

Crypto

CFD

Currencies

Support

Gold

GOLD – Technical Analysis – 4h

January 9, 2026 17:02

Quick Summary

The chart shows a dynamic movement in the asset with recent bullish signals. It reflects a potential recovery phase after a downturn.

Key levels and indicators suggest further insights into the asset’s performance.

Candlestick Analysis

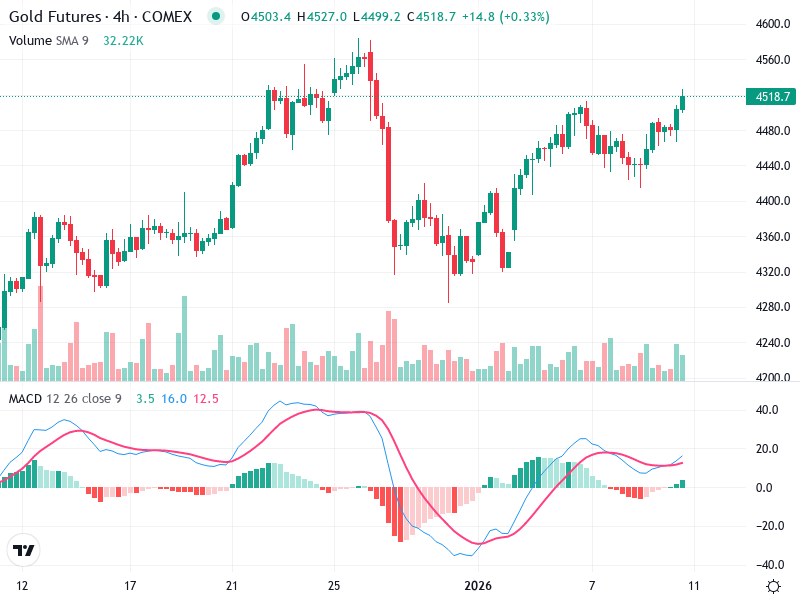
The overall trend appears to be in transition, initially going up, then significantly down, followed by recent recovery.

The latest candles reflect strong bullish activity suggesting a recovery, with no significant reversal patterns like hammer or doji in the immediate timeframe.

The price recently broke a minor resistance around 4490, indicating a potential breakout to higher levels.

MACD Analysis

The MACD line is above the Signal line, showing a recent bullish crossover, which is a positive momentum sign.

The MACD histogram displays increasing positive bars, indicating growing bullish momentum.

No clear divergences between MACD and price action, supporting upward price movement.

Volume Analysis

There has been an increase in volume, especially during recent bullish candles, confirming the upward price movement.

The increased volume provides credibility to the bullish move, suggesting strong buying interest.

Noticeable volume spikes during up-days indicate possible institutional activity or heightened market interest.

Support & Resistance

Key support is around 4350-4370, where the price found a base before reversing.

Immediate resistance is around 4550, slightly above the current price, which may soon be tested.

Actionable Insights

Due to the MACD bullish crossover and volume confirmation, a short-term buy strategy could be considered, targeting a test of the 4550 resistance.

Watch for confirmation of the breakout above 4550 for further bullish momentum. Conversely, a failure at this level could suggest caution.

A breakdown below 4480 with significant volume may indicate a false breakout, suggesting a defensive approach.

The AI Technical Analysis Center is an informational tool only and does not constitute investment or trading advice.
This site is registered on wpml.org as a development site. Switch to a production site key to remove this banner.