Generic selectors
Exact matches only
Search in title
Search in content
Post Type Selectors

Popular stocks

Crypto

CFD

Currencies

Support

Gold

GOLD – Technical Analysis – 4h

January 12, 2026 17:03

Quick Summary

The gold Futures 4h chart showcases a significant upward trajectory characterized by bullish patterns and breaches of previous resistance levels. This asset demonstrates strong buying momentum, validated by technical indicators.

As the price consistently rises, supported by increasing volume, the asset is displaying potential for continued bullish movement under current conditions.

Candlestick Analysis

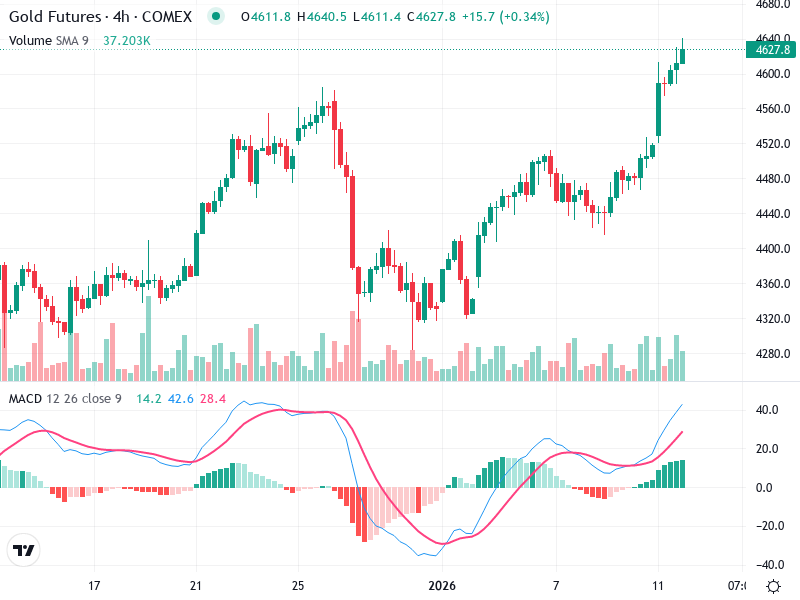
There is a strong bullish trend observable in the recent candlesticks, marked by taller green candles, indicating strong buying momentum.

A potential “bullish engulfing” pattern can be seen as the trend reverses around the 4320 level, suggesting a strong upward reversal.

The resistance level around 4600 has been breached, indicating a breakout and potential continuation of the bullish trend.

MACD Analysis

The MACD line has crossed above the Signal line, indicating a bullish crossover which suggests strong upward momentum.

The histogram is steadily increasing, further supporting bullish momentum.

No significant divergences are observed between MACD and price action, supporting confidence in the current trend.

Volume Analysis

There is a noticeable increase in volume as the price rises, providing confirmation of the bullish trend.

The rising volume alongside price increase supports the legitimacy of the breakout above 4600.

No drastic spikes suggesting any unusual institutional activity; the volume increase appears to be steady.

Support & Resistance

Previous resistance now turned support at around 4600.

No immediate resistance level ahead; next significant resistance might be determined by longer timeframes.

Breaching of 4600 area signals potential for further upward moves as selling pressure at this level has been absorbed.

Actionable Insights

Consider buying on retracement towards 4600, using it as a new support level.

For current long positions, consider holding as bullish indicators are strong and supported by volume.

Cautious short positions may be taken only if price action shows a reversal pattern around significant psychological levels or overbought warnings from other indicators.

The AI Technical Analysis Center is an informational tool only and does not constitute investment or trading advice.
This site is registered on wpml.org as a development site. Switch to a production site key to remove this banner.