Generic selectors
Exact matches only
Search in title
Search in content
Post Type Selectors

Popular stocks

Crypto

CFD

Currencies

Support

Gold

GOLD – Technical Analysis – 4h

January 13, 2026 17:03

Quick Summary

The gold Futures 4-hour chart reveals significant patterns and trends.

A bullish outlook is supported by key technical indicators, suggesting potential upward movement.

However, caution is advised due to varying signals from different analyses.

Candlestick Analysis

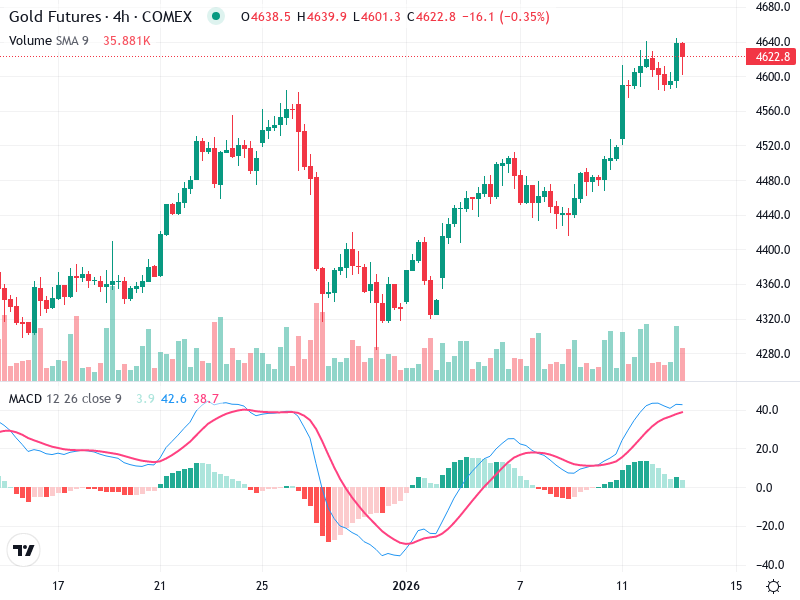
The chart shows a series of bullish candlesticks, indicating strong upward momentum.

A doji pattern near January 21 suggests indecision, followed by a bullish engulfing pattern confirming the ascent.

The overall trend is bullish, marked by consecutive higher highs and higher lows.

MACD Analysis

The MACD line, positioned above the Signal line, confirms bullish momentum.

However, the lines converging hint at a possible slowdown or reversal.

No significant divergences are currently observed in the MACD analysis.

Volume Analysis

An increase in volume accompanies the recent upward move, bolstering the bullish trend.

Consistent volume with rising prices indicates a healthy uptrend.

There have been no noticeable extreme volume spikes, suggesting steady market activity.

Support & Resistance

Current resistance is seen around the 4640 level, with a break above suggesting further increases.

Support levels to monitor include 4560 and 4500, crucial for assessing potential reversals.

A fall below these supports might indicate a trend change.

Actionable Insights

Consider buying on dips near 4560 support if the bullish trend continues.

A confirmed close below 4500 might warrant short positions.

If holding a long position, watch around 4640 for significant resistance signs.

The AI Technical Analysis Center is an informational tool only and does not constitute investment or trading advice.
This site is registered on wpml.org as a development site. Switch to a production site key to remove this banner.