Generic selectors
Exact matches only
Search in title
Search in content
Post Type Selectors

Popular stocks

Crypto

CFD

Currencies

Support

Gold

GOLD – Technical Analysis – 4h

January 14, 2026 17:02

Quick Summary

The chart for reveals an upward momentum, suggesting a strong bullish trend.

Key technical patterns in the analysis indicate potential for continued upside.

Candlestick Analysis

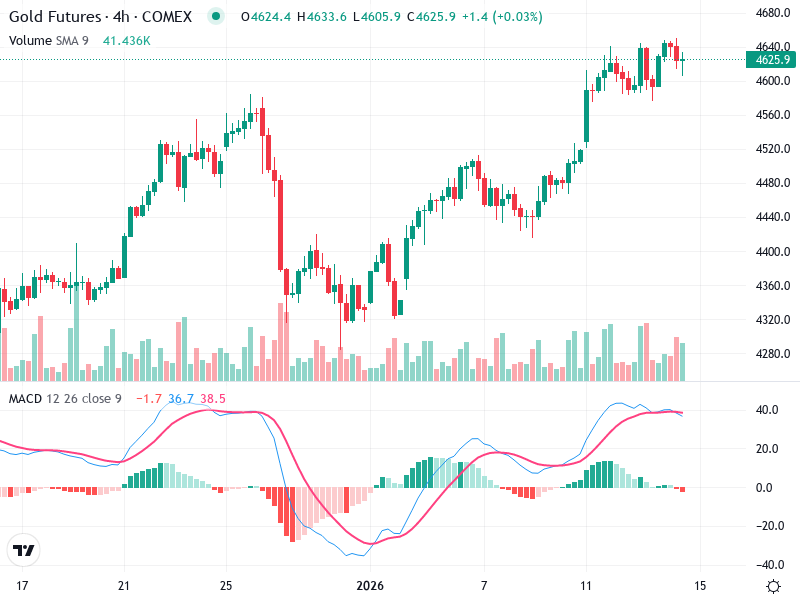
There is a strong upward trend visible with several consecutive bullish candles, indicating a potential bullish continuation.

The trend appears bullish, particularly after the notable rise from the 4320 level.

Currently, the price is consolidating around 4625. Further movement above this level could signal a breakout.

MACD Analysis

The MACD line is above the Signal line, indicating a bullish crossover.

The histogram shows increasing positive momentum, although there is a slight decrease towards the end, suggesting waning momentum.

No significant divergences are noted currently between the MACD and price action.

Volume Analysis

There is consistent volume aligning with bullish price movements, reinforcing the uptrend.

There are no major volume spikes, suggesting a steady accumulation rather than aggressive buying or institutional activity.

The volume patterns align with the current bullish trend, indicating ongoing investor interest.

Support & Resistance

Key support is around the 4480 mark, where consolidation previously occurred.

The current resistance level is around 4630-4640, where price consolidates.

These levels are crucial for determining potential breakout points and guiding trading decisions.

Actionable Insights

Consider a buy if price breaks above the resistance at 4640 with strong volume.

Watch for increased volume to confirm any breakout. Monitor for a potential decrease in bullish momentum as indicated by the MACD histogram.

Traders should look for confirmation of a breakout above 4640 with supporting volume and watch for any bearish reversal signals such as a strong bearish candle or MACD histogram downturn.

The AI Technical Analysis Center is an informational tool only and does not constitute investment or trading advice.
This site is registered on wpml.org as a development site. Switch to a production site key to remove this banner.