January 23, 2026 17:03
The chart analysis reveals significant patterns that are crucial for understanding future price movements of the asset. A key focus rests on the bearish momentum emerging.
Additionally, understanding segment trends and volume changes further aids in assessing potential market directions aimed at predicting possible support and resistance levels.
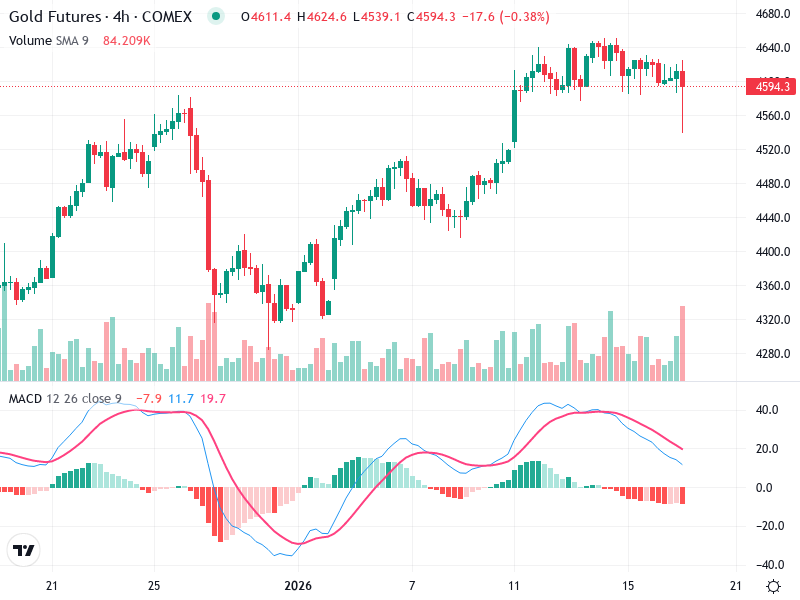
The chart shows a mix of bullish and bearish patterns. Recently, there’s a bearish engulfing pattern, indicating potential further downside.
The trend has shifted from an upward momentum to sideways with a recent bearish tilt.
The recent drop to around 4590 suggests a test of support levels. Watch for a further breakout below this level.
The MACD line has crossed below the signal line, indicating a bearish crossover, which suggests a change in momentum to the downside.
The MACD histogram is in the negative, reinforcing bearish momentum currently.
There is no clear divergence between MACD and price action at this moment.
An increase in volume accompanies recent bearish candles, supporting the downward pressure.
The spike in volume can indicate potential institutional selling or profit-taking, emphasizing the bearish outlook.
Notable volume spikes should be watched, especially if they coincide with price movements through support or resistance levels.
Around 4590 is a critical support zone. A break below could reinforce bearish momentum.
Near recent highs around 4640. Any upward move should be watched for failure near this area.
Currently, the sentiment leans bearish. Consider short positions if the price closes below 4590 with strong volume confirmation.
Monitor for bullish reversal signals if the price holds above the support or reverts with a significant bullish candlestick pattern.
Set stop-loss limits near recent highs to manage potential upside risk due to volatility.