Generic selectors
Exact matches only
Search in title
Search in content
Post Type Selectors

Popular stocks

Crypto

CFD

Currencies

Support

Gold

GOLD – Technical Analysis – 4h

January 21, 2026 17:03

Quick Summary

The asset is showcasing a strong bullish trend as evidenced by recent price movements. A critical breakout has occurred, pushing the asset to new highs.

Investors should closely monitor the MACD and volume trends for further insights into momentum and potential reversals.

Candlestick Analysis

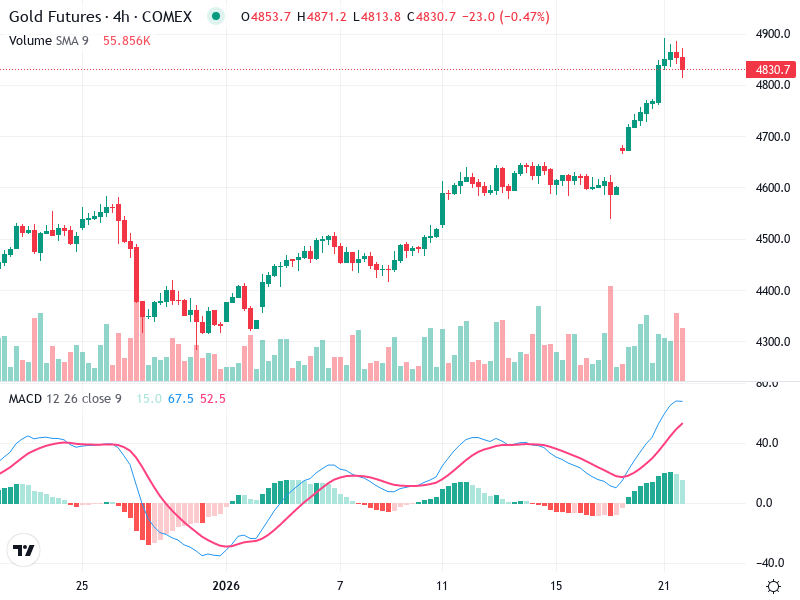
The overall trend in the chart is bullish, as indicated by a series of higher highs and higher lows leading up to the current price level.

At the recent highs, there is a formation resembling a potential doji or small-bodied candle, which indicates indecision and possible trend reversal or consolidation.

A breakout occurred around the 4600 level, leading to a strong upward move. Any pullback to this level could be significant for support.

MACD Analysis

The MACD line is above the Signal line, confirming bullish momentum. The lines are diverging, which suggests increasing momentum.

The histogram is in positive territory and increasing, indicating strengthening momentum.

There is no visible divergence between the MACD and price, which supports the current bullish trend.

Volume Analysis

An increase in volume accompanied the recent breakout, supporting the validity of the upward move.

Volume has decreased slightly as price approaches recent highs, indicating potential waning momentum.

The significant volume spike during the breakout may suggest institutional buying interest.

Support & Resistance

Key support is identified around 4600, where the breakout occurred.

Immediate resistance is at the recent high near 4870. A break above this level could signal further upside.

Monitoring these levels is crucial for predicting future price movements.

Actionable Insights

Consider buying on a pullback to the support zone around 4600 with confirmation of bullish reversal patterns.

Watch for bearish reversal patterns, such as a definitive bearish candlestick formation, particularly if accompanied by an increase in selling volume.

Current holders might continue to hold as long as price remains above the support level and MACD remains bullish.

The AI Technical Analysis Center is an informational tool only and does not constitute investment or trading advice.
This site is registered on wpml.org as a development site. Switch to a production site key to remove this banner.