Generic selectors
Exact matches only
Search in title
Search in content
Post Type Selectors

Popular stocks

Crypto

CFD

Currencies

Support

Gold

NGAS – Technical Analysis – 4h

February 26, 2026 17:04

Quick Summary

The Henry Hub Natural Gas Futures chart currently reveals a bearish trend. The asset has been showing lower highs and lower lows, indicating prolonged selling pressure. Important technical indicators suggest caution for bullish trades at this time.

Candlestick Analysis

The overall trend on the chart is bearish, demonstrated by lower highs and lower lows over the past weeks.

There aren't any prominent reversal candlestick patterns recently, like bullish engulfing or hammer patterns. The presence of small-bodied candles suggests indecisiveness or consolidation.

The price appears to be testing support around the $2.775 area. A decisive break below this support might indicate further downside potential.

MACD Analysis

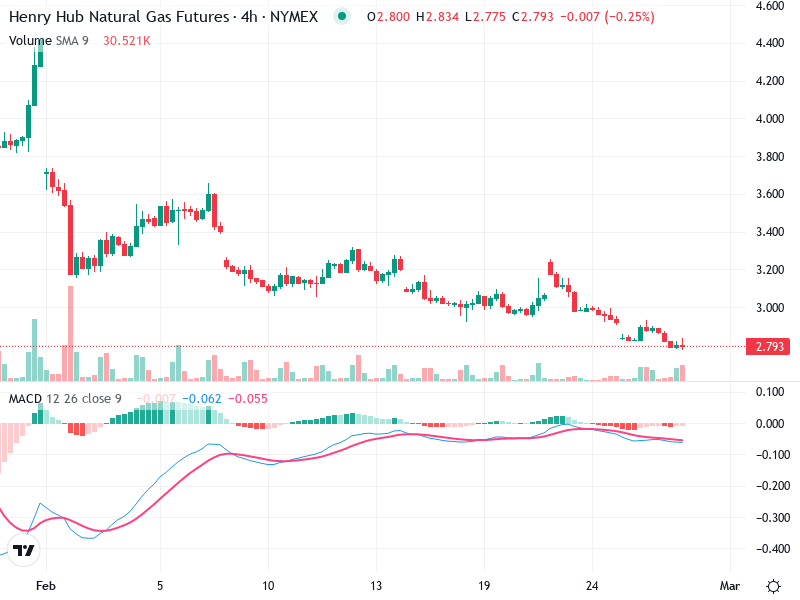
The MACD line is currently below the Signal line, which is typical in bearish movements. However, they are close together, suggesting decreasing bearish momentum.

The MACD histogram is slightly negative, indicating weak momentum favoring the bears.

There are no clear divergences between the MACD and the price action at the moment.

Volume Analysis

Volume has been relatively consistent with slight increases during the recent price drops, which supports the bearish trend.

There are no significant volume spikes that stand out to suggest major institutional activity or potential reversals.

Volume trends align with current price movement, reinforcing the prevailing market sentiment.

Support & Resistance

The key support level is around $2.775. A break below this could signal further declines.

The nearest resistance is around the $3.200 level, where a previous consolidation occurred.

Monitoring these levels could provide clues for future price direction shifts.

Actionable Insights

If the price breaks below the $2.775 support with volume confirmation, consider short positions or protecting long exposure.

If a reversal candlestick pattern forms above this support, watch for confirmation before entering long positions.

Observe volume changes and the MACD for any signs of reversal or continuation in the current trend. A bullish crossover in MACD could indicate potential for a rebound.

The AI Technical Analysis Center is an informational tool only and does not constitute investment or trading advice.
This site is registered on wpml.org as a development site. Switch to a production site key to remove this banner.