Generic selectors
Exact matches only
Search in title
Search in content
Post Type Selectors

Popular stocks

Crypto

CFD

Currencies

Support

Gold

NGAS – Technical Analysis – 4h

February 27, 2026 17:04

Quick Summary

The chart indicates cautious market movement.

Volume fluctuations and weak signals suggest a careful approach.

Candlestick Analysis

The overall trend is bearish, moving towards sideways.

No significant bullish or bearish reversal candlestick patterns are immediately visible.

The recent candles show small bodies, indicating indecision in the market.

MACD Analysis

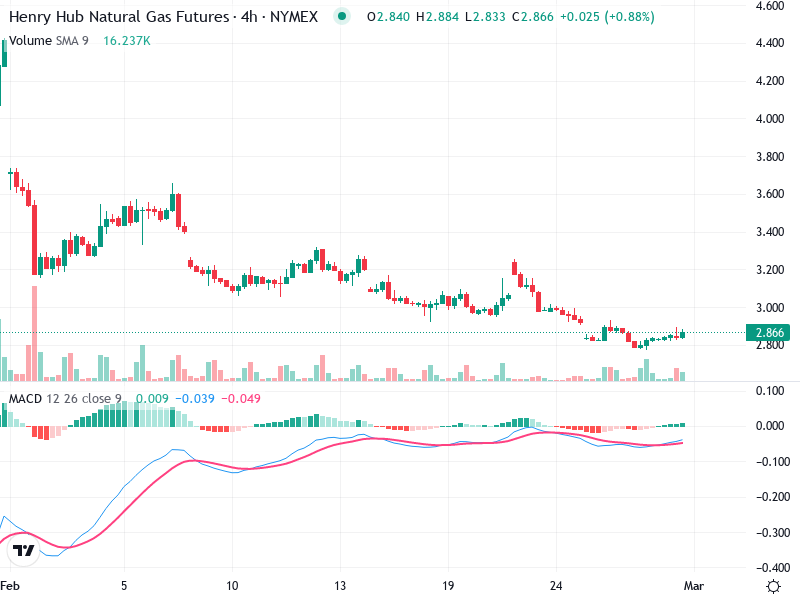
The MACD line is slightly above the signal line, but both are close to the zero line, suggesting weak bullish momentum.

The histogram shows tiny positive bars indicating the possibility of a bullish turnaround, though not strong.

No significant divergences are observed currently between MACD and price.

Volume Analysis

A noticeable decrease in volume following previous higher activity suggests a reduction in momentum.

The lower volume during potential reversal areas suggests weak conviction among traders.

Previous spikes align with significant price moves, indicating potential institutional involvement.

Support & Resistance

Support is around 2.800, which acts as a key level where the price has shown a tendency to stabilize.

Resistance is around the 2.900 level, where the price has struggled to break through.

These levels are crucial for future price movements.

Actionable Insights

Look for a confirmed bullish pattern above 2.900 with increased volume for a potential buy.

Consider short positions if the price falls below 2.800 with strong volume.

Current weak indicators suggest holding unless new signals emerge.

The AI Technical Analysis Center is an informational tool only and does not constitute investment or trading advice.
This site is registered on wpml.org as a development site. Switch to a production site key to remove this banner.