Generic selectors
Exact matches only
Search in title
Search in content
Post Type Selectors

Popular stocks

Crypto

CFD

Currencies

Support

Gold

NGAS – Technical Analysis – 4h

March 2, 2026 17:05

Quick Summary

The Henry Hub Natural Gas Futures chart shows recent bullish movements with potential for further upward momentum. A notable reversal was observed after a prolonged downtrend, positioning the asset at a critical consolidation phase.

The asset is testing major resistance levels, indicating investor interest and possible future breakouts.

Candlestick Analysis

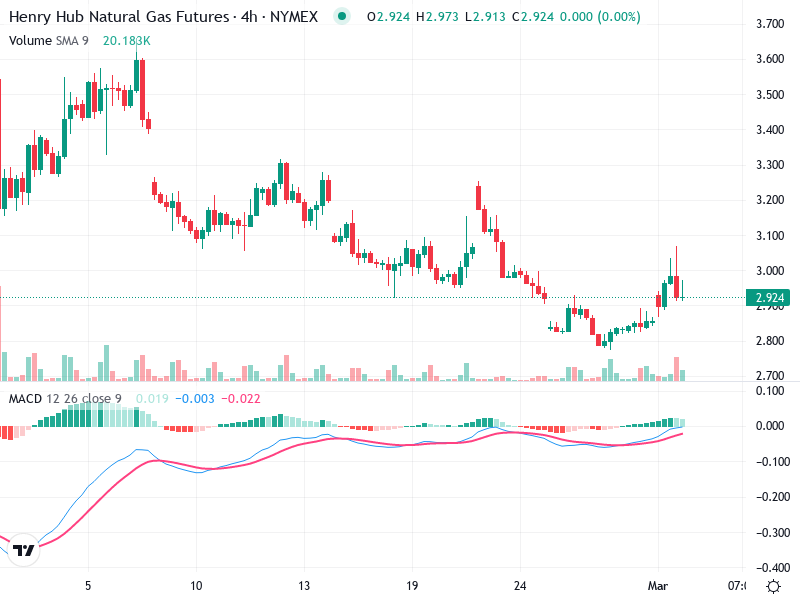
A recent bullish engulfing pattern is visible around the $2.8 level, suggesting a potential reversal from downtrend to uptrend.

Doji candlesticks appear at recent highs, indicating potential indecision or reversal.

The chart shows a recent bullish reversal after a prolonged downtrend. The price is currently moving sideways, indicating consolidation around the $2.9 level.

MACD Analysis

There's a recent bullish crossover where the MACD line crosses above the Signal line, indicating potential bullish momentum.

The histogram is positive, and bars are growing in size, suggesting strengthening upward momentum.

No significant divergences are noted between the MACD and price action at this moment.

Volume Analysis

An increase in volume accompanied the recent bullish reversal, supporting the validity of the breakout.

A significant spike in volume supports the upward price movement, suggesting possible institutional investment.

Note the volume spike aligning with the bullish engulfing pattern, indicating strong buy interest.

Support & Resistance

Key support is around $2.8, which acted as a rebound point.

Primary resistance is seen at $3.00, with additional potential resistance around $3.10.

Breakout zone identified just above $3.00, with recent attempts to breach this level. Significant resistance could turn into a strong support level if surpassed.

Actionable Insights

Consider buying if there is a confirmed close above the $3.00 resistance level with strong volume.

Watch for a reversal signal or bearish pattern near the resistance zone at $3.00.

Current price action suggests that holding is advisable until a clear breakout or reversal signal is confirmed.

The AI Technical Analysis Center is an informational tool only and does not constitute investment or trading advice.
This site is registered on wpml.org as a development site. Switch to a production site key to remove this banner.