Generic selectors
Exact matches only
Search in title
Search in content
Post Type Selectors

Popular stocks

Crypto

CFD

Currencies

Support

Gold

NGAS – Technical Analysis – 4h

March 4, 2026 17:05

Quick Summary

The Henry Hub Natural Gas Futures chart displays recent bearish activity, emphasizing a downward trend. A breakout below key levels suggests potential continuation of this downward movement. Analyzing the chart reveals significant involvement from sellers, possibly driven by broader market influences.

Candlestick Analysis

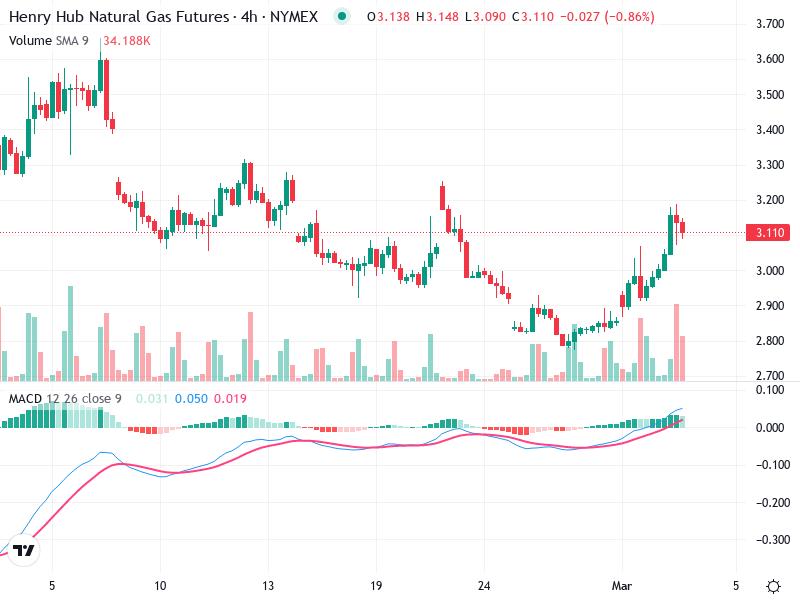
The chart shows a recent bearish candlestick, indicating downward pressure.

The trend appears to be bearish, especially after a recent peak around early March.

There was a breakout to the downside from the $3.00 level, acting as a psychological resistance.

MACD Analysis

The MACD line is below the Signal line, indicating bearish momentum.

The histogram supports the bearish signal, showing negative values.

No significant divergence is noted between the MACD and price action.

Volume Analysis

A notable increase in volume accompanied the recent decline.

The increased volume during the decline could indicate strong selling pressure.

No exceptionally unusual volume spikes are observed, but increased volume suggests trend continuation.

Support & Resistance

Key support is around the $2.85 level, near recent lows.

Resistance is around $3.00, crucial for potential reversal attempts.

Breaking below $2.85 could lead to further declines.

Actionable Insights

Current analysis leans towards a bearish outlook, suggesting holding short positions.

Look for MACD turning upward or bullish candlestick patterns for reversal signals.

Be cautious of a reversal if a bullish crossover in MACD or strong bullish candle appears.

The AI Technical Analysis Center is an informational tool only and does not constitute investment or trading advice.
This site is registered on wpml.org as a development site. Switch to a production site key to remove this banner.