Generic selectors
Exact matches only
Search in title
Search in content
Post Type Selectors

Popular stocks

Crypto

CFD

Currencies

Support

Gold

NGAS – Technical Analysis – 4h

March 6, 2026 17:04

Quick Summary

The chart for the asset displays a bullish sentiment with recent movements indicating potential upward momentum.

The presence of bullish patterns and increased volume supports this trend. Watch for key levels to confirm the continuation of the uptrend.

Candlestick Analysis

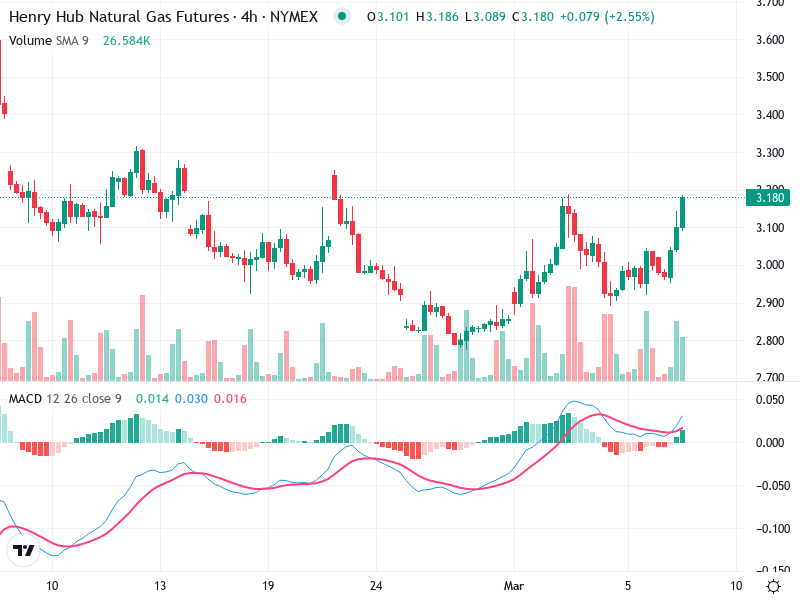
The chart shows several bullish candlestick patterns, such as bullish engulfing patterns, which indicate potential bullish reversals.

Also, notice the presence of long lower shadows in previous sessions, suggesting buying pressure.

There is a noticeable uptrend in the short term, following a period of consolidation.

MACD Analysis

There is a bullish crossover where the MACD line crosses above the Signal line, suggesting a potential upward momentum.

The MACD histogram is in the positive territory and expanding, indicating strengthening bullish momentum.

There are no clear divergences between MACD and price action, supporting the upward trend.

Volume Analysis

There is an uptick in volume coinciding with the current price increase, which supports the breakout from the consolidation zone.

Spikes in volume are consistent with bullish price action, possibly indicating institutional buying interest.

The volume analysis reinforces the bullish sentiment, aligning with price movements.

Support & Resistance

Strong support is around the 3.000 level, where buying interest has previously emerged.

The next significant resistance is at approximately 3.300, where prior highs were reached.

Monitoring these levels can provide insights into potential future price action.

Actionable Insights

Consider buying on a confirmed breakout above the recent high with increased volume.

Monitoring the MACD for sustained bullish momentum would provide additional confidence.

A failure to maintain levels above 3.100 with declining volume may suggest a reconsideration of bullish positions.

The AI Technical Analysis Center is an informational tool only and does not constitute investment or trading advice.
This site is registered on wpml.org as a development site. Switch to a production site key to remove this banner.