Generic selectors
Exact matches only
Search in title
Search in content
Post Type Selectors

Popular stocks

Crypto

CFD

Currencies

Support

Gold

NSDQ – Technical Analysis – 1D

August 20, 2025 07:32

Quick Summary

The NASDAQ 100 Index has experienced a sustained upward trend over the past several months, but recent indicators suggest a potential change in sentiment.

Short-term fluctuations and technical patterns are hinting at a possible shift towards bearish momentum, requiring traders to exercise caution.

Candlestick Analysis

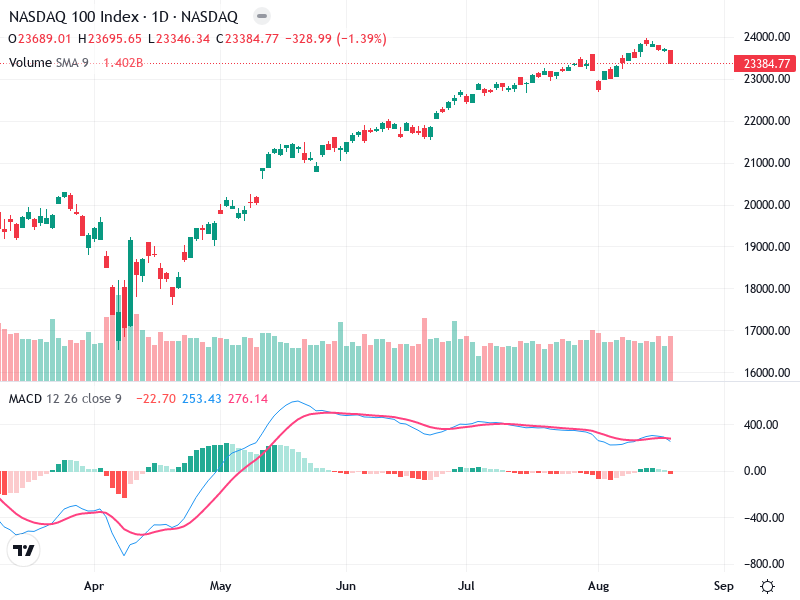
The chart shows a transition from bullish to potentially bearish sentiment, indicated by recent candlesticks.

The last few candlesticks reflect a bearish pattern with a potential downward move, as seen in the red candlestick with a significant loss.

The overall trend has been bullish for several months, but currently, a sideways movement is transitioning into a possible bearish pullback.

MACD Analysis

The MACD line is slightly above the signal line, suggesting recent bullish momentum which might be losing strength given the convergence.

The histogram shows diminishing positive momentum, indicating the possibility of a bearish crossover if this trend persists.

No significant divergence is currently visible, but diminishing momentum should be monitored closely.

Volume Analysis

There is a noticeable increase in volume during the recent downward movement, which supports the bearish pullback, suggesting stronger selling pressure.

Unusual volume spikes are present, which might imply institutional activity or heightened investor anxiety around current price levels.

Volume analysis reinforces the potential for a bearish shift as selling pressure increases.

Support & Resistance

The support level around 22,000 should be watched closely; a breach may push prices lower.

The resistance level remains near the 24,000 mark, where the recent peak before the downturn occurred.

These levels are critical for traders to monitor to anticipate further price movements.

Actionable Insights

Traders might consider a hold or sell strategy if bearish momentum is confirmed with further price drops and MACD crossover.

Look for confirmation of a bearish crossover in the MACD or breakdown below the 22,000 support for clarity on sustained downward movement.

Monitor volumes and price action closely, especially around critical support levels, and watch for any sudden shifts in momentum that could hint at a reversal or deeper correction.

The AI Technical Analysis Center is an informational tool only and does not constitute investment or trading advice.
This site is registered on wpml.org as a development site. Switch to a production site key to remove this banner.