Generic selectors
Exact matches only
Search in title
Search in content
Post Type Selectors

Popular stocks

Crypto

CFD

Currencies

Support

Gold

NSDQ – Technical Analysis – 1D

October 8, 2025 12:03

Quick Summary

The chart indicates that the asset is demonstrating a strong upward trend, with higher highs and higher lows over the recent months. Current price movements suggest consolidation and possible breakout opportunities, particularly near historical highs.

Investors should remain vigilant for potential reversals or breakout confirmations, as significant levels are being tested.

Candlestick Analysis

The chart shows a strong bullish trend over the past months with higher highs and higher lows.

The most recent candlesticks indicate hesitation, with a few small-bodied candles suggesting potential consolidation.

No major reversal patterns like a bearish engulfing or doji are visible currently.

MACD Analysis

The MACD line is slightly above the Signal line, maintaining a bullish crossover. This supports the ongoing bullish trend.

The MACD histogram shows diminishing positive momentum, indicating potential slowing in bullish strength.

No clear divergence between the MACD and price action suggests alignment with the price movement.

Volume Analysis

There was a notable spike in volume in mid-August, which coincided with a large bullish move.

Recent volume trends have normalized, suggesting less enthusiasm or uncertainty among traders.

The past volume spike could imply institutional buying interest that is important for sustaining the trend.

Support & Resistance

Strong resistance appears around the 25,000 mark, which has acted as a psychological barrier.

Key support is identified around 24,000, where previous consolidation and buying interest occur.

Monitor these levels for potential breakout or reversal.

Actionable Insights

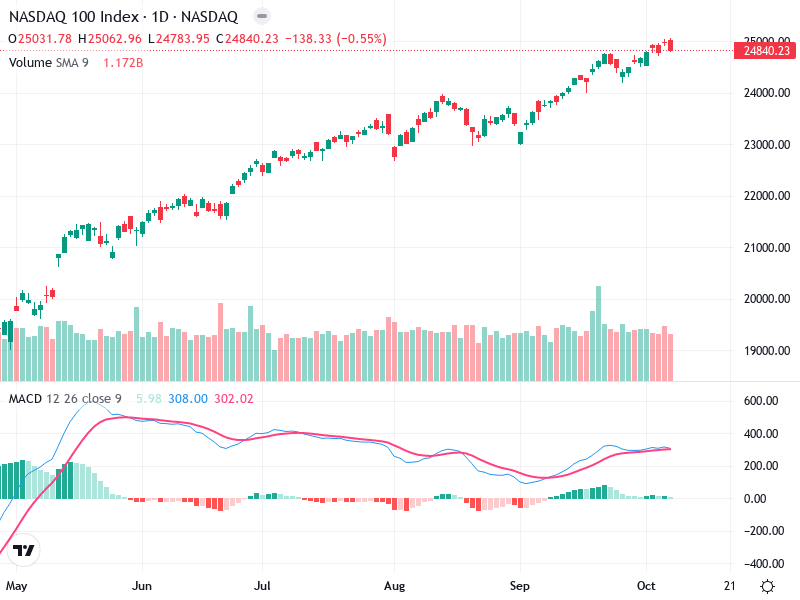
Consider entering a long position if there's a confirmed breakout above the 25,000 level, accompanied by increasing volume.

Be cautious of a reversal signal if the price fails to breach the resistance, particularly if the MACD turns bearish.

Continue holding if already in a position, monitoring for strong breakout confirmations or emerging warning signals.

The AI Technical Analysis Center is an informational tool only and does not constitute investment or trading advice.
This site is registered on wpml.org as a development site. Switch to a production site key to remove this banner.