Generic selectors
Exact matches only
Search in title
Search in content
Post Type Selectors

Popular stocks

Crypto

CFD

Currencies

Support

Gold

NSDQ – Technical Analysis – 4h

September 2, 2025 07:00

Quick Summary

The NASDAQ 100 Index is showcasing a predominantly bullish trend since mid-August. A closer inspection reveals potential reversal signals or consolidation near the top resistance zones. Monitoring the upcoming movements is essential.

Technical indicators are presenting mixed signals, suggesting that traders adopt a cautious approach. Volume-backed confirmation will be key in determining future price movements.

Candlestick Analysis

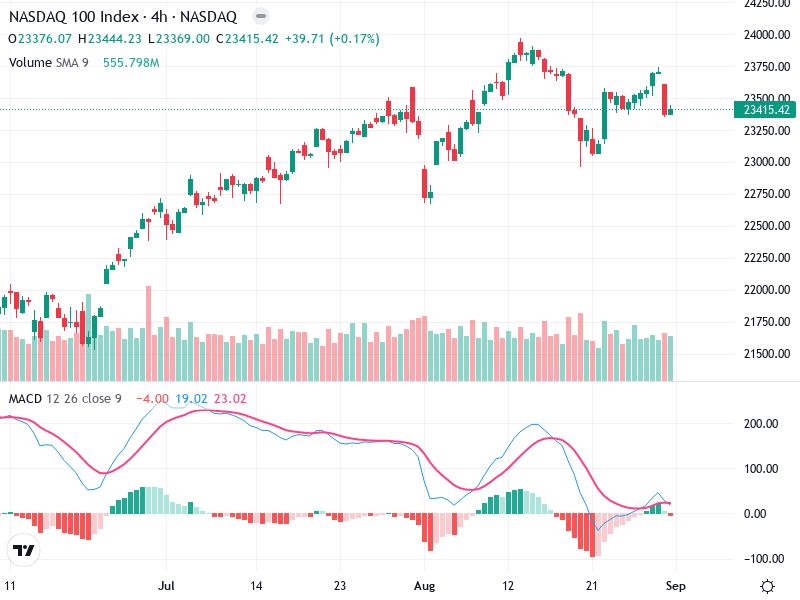
The overall trend appears to be bullish, moving upwards since mid-August.

No clear candlestick patterns like bullish engulfing or doji are visible. However, recent candles show some indecision at the top, which could be signaling a potential reversal or pause.

There's a recent attempt to break above 23,500 which is followed by a pullback, indicating it as a resistance zone for now.

MACD Analysis

The MACD line is currently intersecting with the Signal line indicating a neutral to slightly bearish sentiment in the very short term.

The histogram is near the zero line, suggesting fading momentum. The lack of a strong separation between MACD and Signal lines supports a cautious approach.

No apparent divergences are observed between price movement and MACD at this point.

Volume Analysis

Recent trading volume mirrors the sideways movement, indicating a lack of strong conviction in either direction.

Slight increase in volume with upward price movements suggests some buying interest but not enough to override the resistance zone convincingly.

No significant volume spikes indicating major institutional activity.

Support & Resistance

Around 23,200 seems to be holding as support based on previous lows.

23,500 is acting as a resistance, where the price has attempted but failed to break above significantly.

Monitoring the price behavior around these levels is crucial for determining future action.

Actionable Insights

Hold: Until there is clearer confirmation of directional movement, a hold strategy might be appropriate.

Potential Buy: Consider buying if the price decisively breaks above the 23,500 resistance with increased volume.

Potential Sell: A drop back towards the 23,200 support could be a sell signal if accompanied by higher selling volume.

The AI Technical Analysis Center is an informational tool only and does not constitute investment or trading advice.
This site is registered on wpml.org as a development site. Switch to a production site key to remove this banner.