Generic selectors
Exact matches only
Search in title
Search in content
Post Type Selectors

Popular stocks

Crypto

CFD

Currencies

Support

Gold

NSDQ – Technical Analysis – 4h

January 12, 2026 08:00

Quick Summary

The chart for the NASDAQ 100 Index is showing potential bullish momentum with a series of green candles indicating a positive trend. The asset is moving towards a key resistance level which might dictate further movement.

Investors should watch the 25,750 mark as it could signal a breakout if crossed, while strong support at 24,500 provides a secure floor for the index.

Candlestick Analysis

Recent candlesticks indicate potential bullish momentum, with several green candles forming consecutively.

There are no strong reversal patterns like doji or hammer visible in the immediate recent periods.

The level around 25,750 is approaching a potential resistance zone, as it aligns with previous highs.

MACD Analysis

The MACD line is above the Signal line, indicating a bullish crossover with bullish momentum.

The MACD histogram shows increasing positive values, suggesting strengthening upward momentum.

No significant divergences between MACD and price action are noticeable, aligning well with the price trend.

Volume Analysis

A noticeable increase in volume corresponds with upward price movements, supporting the bullish trend.

There is no distinct spike indicating atypical institutional activity.

Consistent volume levels support the current trend.

Support & Resistance

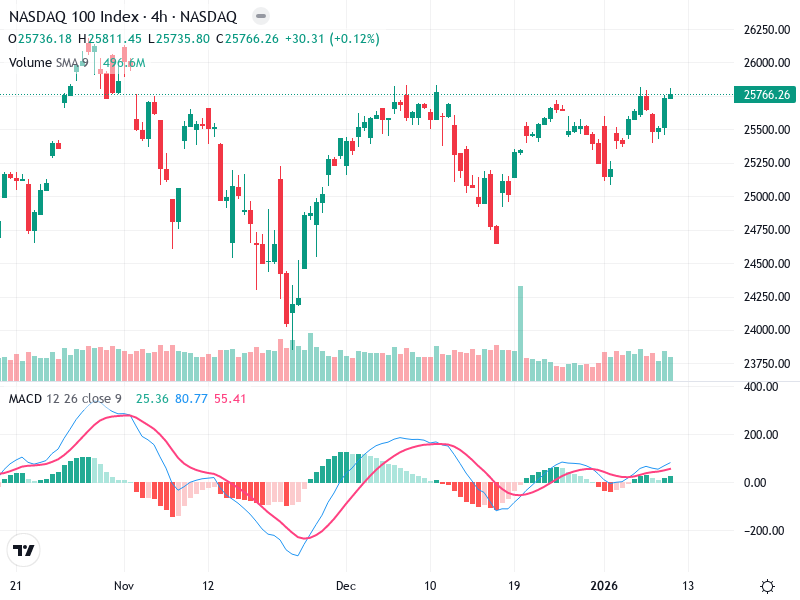
Around 25,750 is a key resistance level. If the price breaks and sustains above this, it might indicate further bullish potential.

Strong support exists around 24,500, which has been tested previously and held.

These levels are crucial for determining the next price action.

Actionable Insights

Consider buying if the price breaks and holds above the 25,750 resistance level with strong volume.

Sell or take profits if price faces strong resistance and reverses from the current level.

Maintain positions if price remains flat between support and resistance levels and shows no clear breakout or reversal signals.

The AI Technical Analysis Center is an informational tool only and does not constitute investment or trading advice.
This site is registered on wpml.org as a development site. Switch to a production site key to remove this banner.