Generic selectors
Exact matches only
Search in title
Search in content
Post Type Selectors

Popular stocks

Crypto

CFD

Currencies

Support

Gold

NSDQ – Technical Analysis – 4h

January 16, 2026 08:01

Quick Summary

The NASDAQ 100 index demonstrates a complex technical landscape with notable candlestick patterns, MACD trends, and volume dynamics.

The index oscillates between defined support and resistance levels, influencing potential trading strategies.

Market participants should be attentive to these technical aspects to anticipate movements.

Candlestick Analysis

The chart exhibits numerous bearish candlestick patterns, such as long red candles, signaling selling pressure.

Currently, there are no significant major reversal patterns like bullish engulfing or hammer visible.

The trend appears sideways with a bearish inclination due to recent lower highs and lows.

MACD Analysis

The MACD line remains below the Signal line, indicating bearish momentum.

The MACD histogram's negative values suggest weakening momentum, though slightly contracting bars might hint at an upcoming reversal or stabilization.

There are no evident strong divergences between MACD and price action.

Volume Analysis

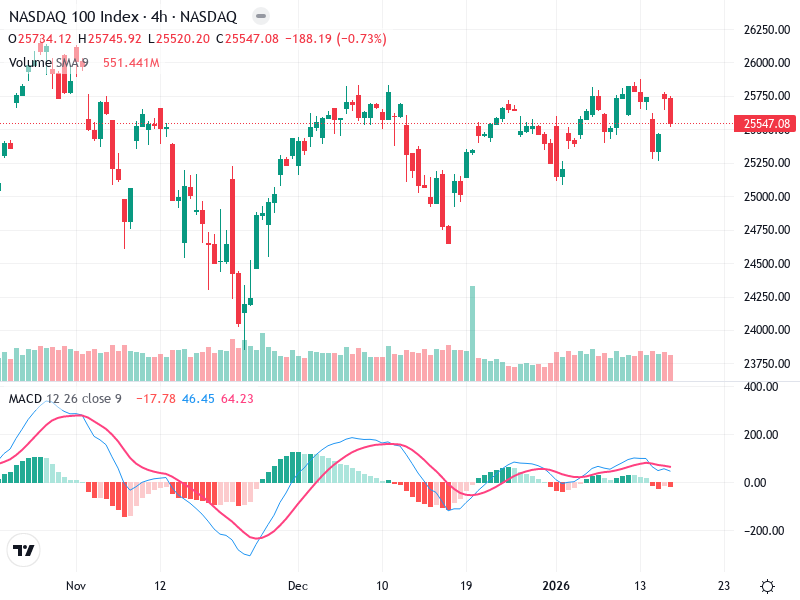
Volume spikes occur in certain zones, aligning with significant price movements.

A significant volume increase, without a matching breakout, could imply potential accumulation or distribution.

Notably, a large volume surge around mid-November points to potential institutional activity.

Support & Resistance

Key support exists around 25,250, forming a recent lower boundary.

Major resistance is established near 25,750, a level recently tested by highs but unmaintained.

High-volume breakthroughs at these levels could indicate strong future movements.

Actionable Insights

Consider a buy if a confirmed close above 25,750 occurs alongside strong volume.

A sell or short opportunity may arise with a breakdown below 25,250 during heightened volume.

Hold strategy is advisable if prices fluctuate between 25,250 and 25,750 without considerable volume.

The AI Technical Analysis Center is an informational tool only and does not constitute investment or trading advice.
This site is registered on wpml.org as a development site. Switch to a production site key to remove this banner.