Generic selectors
Exact matches only
Search in title
Search in content
Post Type Selectors

Popular stocks

Crypto

CFD

Currencies

Support

Gold

NSDQ – Technical Analysis – 4h

January 19, 2026 08:00

Quick Summary

The chart presents an overview of the recent performance of the asset. Periodic shifts in the trend highlight market volatility. Examination of technical indicators suggests possible future movements.

Candlestick Analysis

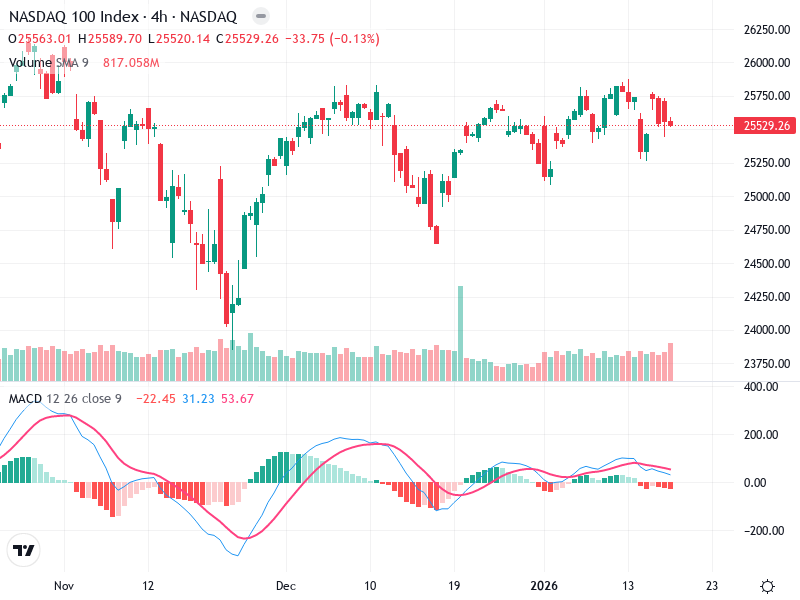
The chart shows a generally sideways trend with periodic shifts towards bullish and bearish movements. This suggests indecision in the market regarding the immediate direction.

Recently, there is no distinct bullish or bearish candlestick pattern such as engulfing or doji that would signal a significant reversal or continuation pattern. The presence of both red and green candles in succession reflects consolidation.

The price has struggled to maintain levels above 25,750, indicating a potential resistance zone, while 25,250 seems to be a current support level.

MACD Analysis

The MACD line is above the Signal line, suggesting a bullish crossover occurred in the past and indicating potential positive momentum.

The histogram is showing decreasing green bars, suggesting that momentum is waning, which is often a precursor to a potential bearish crossover.

There isn’t a clear divergence between MACD and price action at the moment, which implies that the recent price movements are in line with the MACD signals.

Volume Analysis

There's a noticeable spike in volume during the recent price drop, suggesting strong selling pressure which could indicate institutional activity.

The higher volume on down days supports the bearish sentiment seen on those days, reinforcing that any uptrend may face challenges.

The volume spike is worth monitoring for continuation or reversal signals.

Support & Resistance

Around 25,750, the price has hit a ceiling and failed to break through convincingly.

Near 25,250, the price has found significant buying interest, acting as a strong support level.

The analysis suggests staying cautious and waiting for clearer signals while keeping an eye on the identified key levels for potential trade opportunities.

Actionable Insights

Consider buying if the price breaks above 25,750 with increased volume confirming the breakout.

Watch for a bearish crossover in the MACD and increased volume on down days as indicators to sell if the price breaches 25,250.

If the price remains within the current support and resistance levels, holding may be prudent until clearer signals emerge.

The AI Technical Analysis Center is an informational tool only and does not constitute investment or trading advice.
This site is registered on wpml.org as a development site. Switch to a production site key to remove this banner.