Generic selectors
Exact matches only
Search in title
Search in content
Post Type Selectors

Popular stocks

Crypto

CFD

Currencies

Support

Gold

NSDQ – Technical Analysis – 4h

January 22, 2026 08:00

Quick Summary

The NASDAQ 100 Index chart indicates a period of volatility with recent movements attempting a bullish reversal. The asset is currently at a critical juncture, with key support and resistance levels playing a pivotal role in determining the next direction.

Institutional activity and volume trends suggest a cautious sentiment, reflecting a potential shift in market dynamics.

Candlestick Analysis

The overall trend on the 4-hour chart shows some volatility with recent bearish movement that seems to be attempting a bullish reversal.

A potential bullish reversal pattern can be seen with the recent green candlestick bouncing back after a series of red ones, suggesting a recovery attempt.

Previous support around the 25,000 mark seems to have provided a base for the recent bounce.

MACD Analysis

The MACD line is currently below the Signal Line, indicative of a bearish phase.

However, the narrowing gap between the lines suggests waning bearish momentum.

There is slight positive divergence, with the MACD displaying signs of upward movement even while prices were dropping.

Volume Analysis

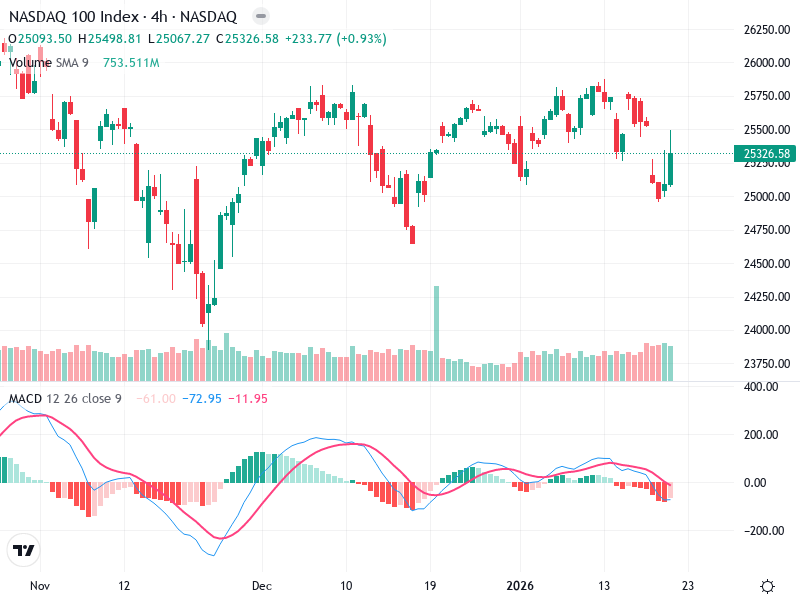
A notable volume spike is visible during recent declines, indicating strong selling pressure.

As the price bounced, volume remained moderate, suggesting cautious sentiment about the reversal.

The large volume spike aligns with significant price movement, possibly indicating institutional participation.

Support & Resistance

Around 25,000 has acted as strong support in recent declines.

Immediate resistance lies around 25,500, with more significant resistance at 25,750.

Watch for how the index behaves at these levels to gauge the strength of the reversal or continuation.

Actionable Insights

Consider buying if the price confirms a reversal with a strong close above 25,500 on high volume.

Selling or shorting if the price fails to hold above 25,000 with increasing volume may be prudent.

Holding until clearer confirmation of direction after breaching resistance is advisable for cautious investors.

The AI Technical Analysis Center is an informational tool only and does not constitute investment or trading advice.
This site is registered on wpml.org as a development site. Switch to a production site key to remove this banner.