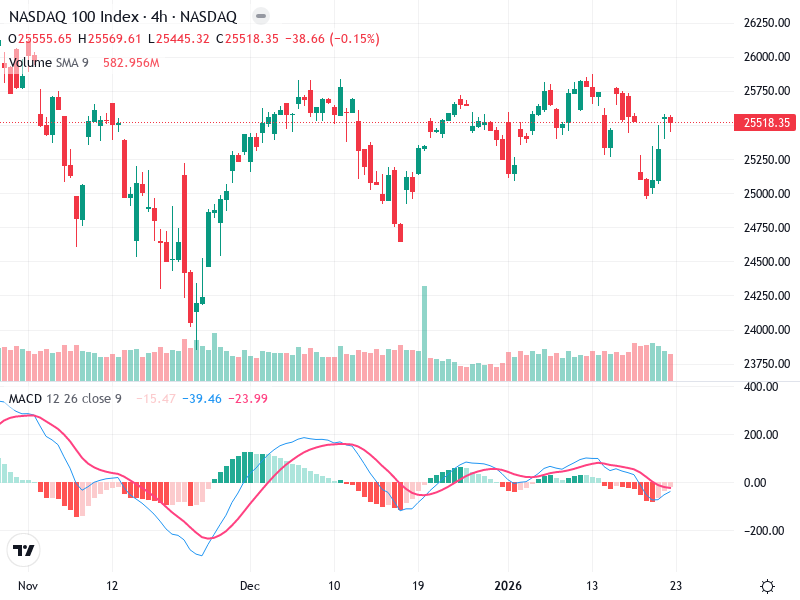
The NASDAQ 100 Index chart presents a sideways trend with fluctuating bullish and bearish phases. A recent bullish reversal pattern is noticeable, indicating potential recovery. Key resistance and support levels are crucial for gauging future movements.
Candlestick Analysis
The chart shows a sideways trend with periodic bullish and bearish phases.
Recently, a bullish reversal pattern, possibly a hammer, is visible, indicating potential recovery from a downtrend.
The price recently bounced off the support level at 25,000.
MACD Analysis
The MACD line has crossed above the signal line, indicating a bullish crossover.
The histogram shows increasing bullish momentum as it moves towards positive territory.
No apparent divergence with price, confirming the current momentum.
Volume Analysis
Noticeable increase in volume during the recent bounce, supporting bullish sentiment.
A large volume spike correlates with a substantial price move, suggesting possible institutional buying.
Overall volume trends align with the bullish momentum observed in price movements.
Support & Resistance
The key resistance level is around 25,750.
Strong support level is observed at 25,000.
Crossing above resistance with high volume may suggest a strong bullish move.
Actionable Insights
Consider a buy position if the price breaks and holds above the 25,750 resistance with increased volume.
Confirmation of the bullish trend by sustained movements above the moving average is essential.
A break below the 25,000 support could indicate a bearish reversal.
The AI Technical Analysis Center is an informational tool only and does not constitute investment or trading advice.