Generic selectors
Exact matches only
Search in title
Search in content
Post Type Selectors

Popular stocks

Crypto

CFD

Currencies

Support

Gold

NSDQ – Technical Analysis – 4h

January 26, 2026 08:01

Quick Summary

The NASDAQ 100 Index chart indicates a predominantly sideways movement with both bullish and bearish tendencies. Recently, there has been a slight upward movement in the trend. The index has shown key support and resistance levels, particularly around the 25,000 and 25,750 marks.

Candlestick Analysis

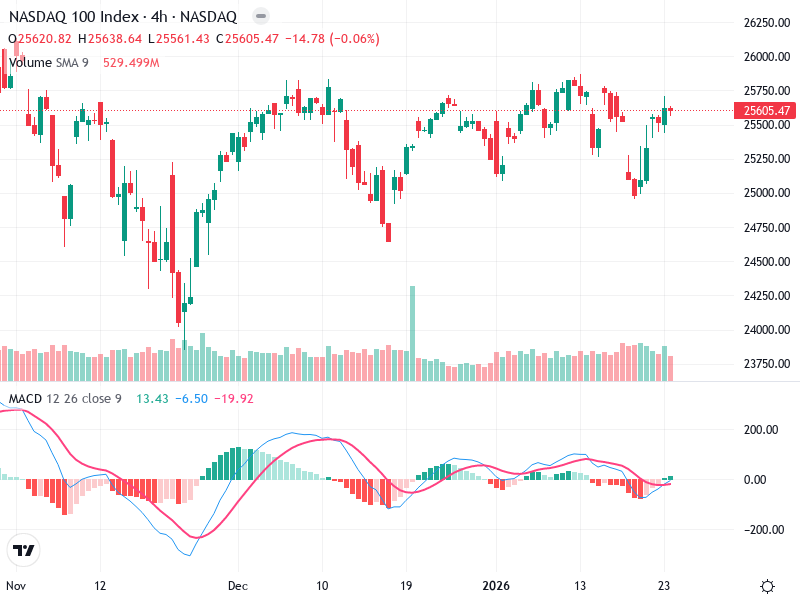
The chart shows a mostly sideways trend with some pockets of both bullish and bearish movements. Recently, there is a slight upward movement.

Near the recent end, there is a potential bullish engulfing pattern suggesting short-term bullish momentum.

A clear resistance zone is noticeable around 25,750, where the price has tested multiple times. The recent pullback around 25,000 could serve as a support level.

MACD Analysis

The MACD line is approaching a bullish crossover with the Signal line, indicating potential upward momentum.

The histogram is transitioning from negative to positive, supporting the bullish sentiment.

No clear divergences observed, indicating that the price action is somewhat aligned with the momentum.

Volume Analysis

There is a noticeable spike in volume in mid-December, indicating strong buying interest, possibly institutional.

Recent price increases are accompanied by rising volume, supporting the upward movement.

The high volume during the price rise might suggest strong interest or accumulation phase.

Support & Resistance

Support is around the 25,000 mark, tested multiple times, reinforcing its strength.

Resistance is at 25,750, a key level where a breakout could lead to further gains.

A breakout above 25,750 is crucial for the continuation of the bullish trend.

Actionable Insights

Consider a buy strategy if the price breaks and holds above the 25,750 resistance level, supported by volume.

Watch for confirmation of the MACD crossover and sustained volume increase to validate the breakout.

Be cautious of any bearish reversal patterns near resistance; failure to break resistance might lead to a retest of support levels at around 25,000.

The AI Technical Analysis Center is an informational tool only and does not constitute investment or trading advice.
This site is registered on wpml.org as a development site. Switch to a production site key to remove this banner.