Generic selectors
Exact matches only
Search in title
Search in content
Post Type Selectors

Popular stocks

Crypto

CFD

Currencies

Support

Gold

NSDQ – Technical Analysis – 4h

January 27, 2026 08:00

Quick Summary

The NASDAQ 100 Index 4-hour chart indicates bullish momentum in the short term.

Traders are closely monitoring the resistance at 25713, as a break above this level could signal further upside.

Candlestick Analysis

The overall trend appears to be bullish in the short term, with higher lows forming on the chart.

Recently, there is a sequence of green candles with small bodies, indicating a period of consolidation just below a key resistance level.

No major reversal patterns like a bullish engulfing or hammer are prominent.

MACD Analysis

The MACD line is slightly above the signal line, suggesting a recent bullish crossover.

The histogram is positive and gradually increasing, indicating building bullish momentum.

No significant divergence between MACD and price action is visible at the moment.

Volume Analysis

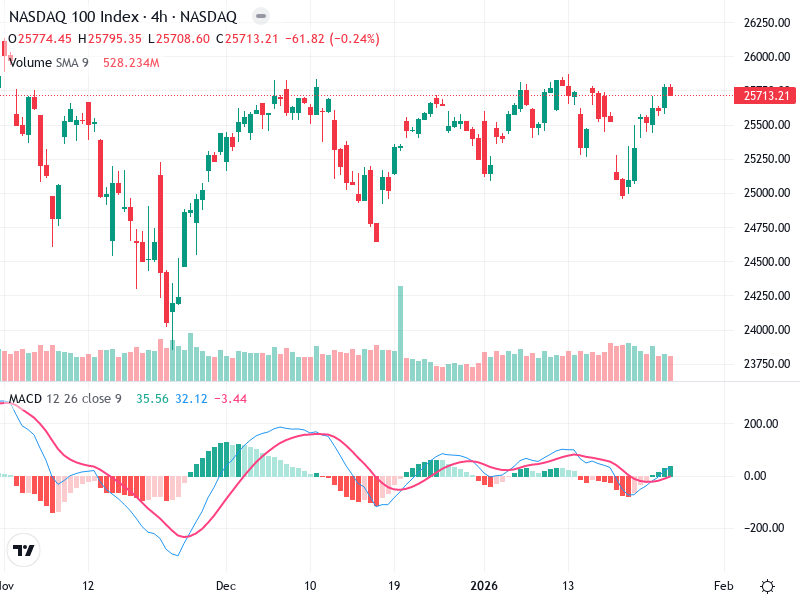
Recently, volume appears steady with no significant spikes, which may suggest the current price action lacks strong conviction.

There was a notable spike in volume earlier in the chart, possibly indicating institutional activity, coinciding with a large movement in price.

The current lack of significant volume increase despite price nearing resistance could indicate a potential lack of strength to break above resistance.

Support & Resistance

The 25000 level has acted as a strong psychological and technical support in the recent past.

The 25713 level is a critical resistance zone.

A confirmed break above this could pave the way for further bullishness.

Actionable Insights

Consider buying on a confirmed breakout above the 25713 level with increased volume.

Caution is advised if the price shows inability to break above resistance, with signs of reversal, such as bearish patterns or high selling volume.

Continue to hold if evidence of a strong uptrend persists beyond the resistance level.

The AI Technical Analysis Center is an informational tool only and does not constitute investment or trading advice.
This site is registered on wpml.org as a development site. Switch to a production site key to remove this banner.