Generic selectors
Exact matches only
Search in title
Search in content
Post Type Selectors

Popular stocks

Crypto

CFD

Currencies

Support

Gold

NSDQ – Technical Analysis – 4h

January 28, 2026 08:01

Quick Summary

The NASDAQ 100 Index is displaying strong bullish momentum in recent charts.

Key patterns and indicators suggest potential upward movement, especially if resistance levels are breached.

Candlestick Analysis

The chart shows several bullish candlestick patterns, including bullish engulfing patterns in the upward movements, indicating strong buying pressure.

The recent movement shows a bullish trend, with prices moving upwards towards the resistance level.

The price is approaching a potential breakout zone near the 25950-26000 area, which might act as a resistance.

MACD Analysis

The MACD line has crossed above the Signal line, indicating a bullish crossover. This suggests potential upward momentum.

The MACD histogram is expanding on the positive side, confirming increasing bullish momentum.

No significant divergence between the MACD and price action is observed currently, supporting the current price trend.

Volume Analysis

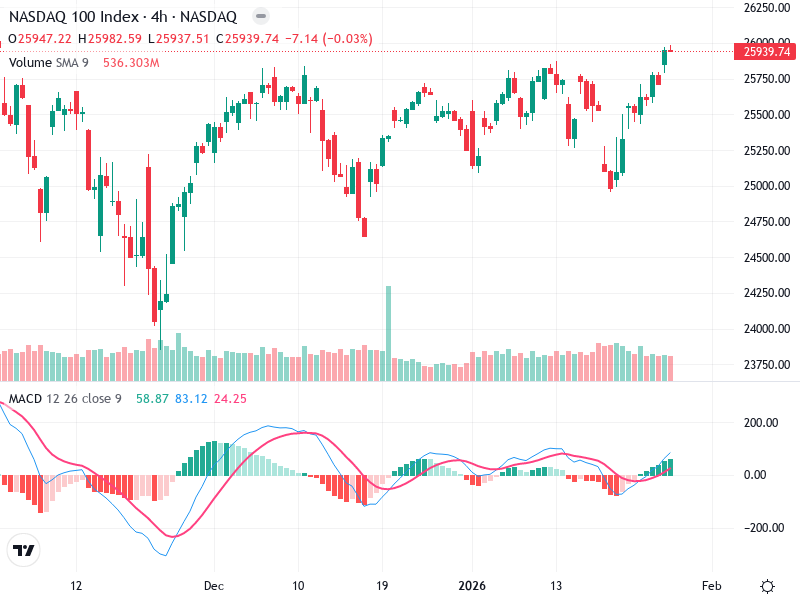
There was a noticeable spike in volume in early December, coinciding with significant price movement, suggesting institutional activity. Since then, volume remains relatively steady.

The current price movement is supported by consistent volume, lending credibility to the upward trend.

The early December spike might have marked the beginning of the recent bullish trend.

Support & Resistance

Resistance is around 25950-26000, where the price is currently testing.

Support is noted around the 25000 level, where prices have previously rebounded.

These levels are crucial for future price action as the resistance could lead to a pullback or a breakout, while support provides a cushion for downward movements.

Actionable Insights

Consider buying on a confirmed breakout above the 26000 level with increased volume for confirmation.

Watch for any bearish reversal patterns or failure to break through resistance for potential selling or shorting opportunities.

If already positioned, hold as long as the bullish trend persists above key support levels.

The AI Technical Analysis Center is an informational tool only and does not constitute investment or trading advice.
This site is registered on wpml.org as a development site. Switch to a production site key to remove this banner.