Generic selectors
Exact matches only
Search in title
Search in content
Post Type Selectors

Popular stocks

Crypto

CFD

Currencies

Support

Gold

NSDQ – Technical Analysis – 4h

January 30, 2026 08:00

Quick Summary

The NASDAQ 100 Index has been showcasing interesting patterns in recent sessions.

The asset is nearing key resistance levels, with bullish indicators present.

Analysis reveals the potential for significant market movements in the near term.

Candlestick Analysis

There is a potential bullish engulfing pattern recently, indicating strong buying interest.

Noticeable candlesticks include a recent hammer, suggesting a potential reversal from bearish to bullish.

The trend is predominantly sideways to slightly bullish. There has been a breakout attempt which needs confirmation.

MACD Analysis

The MACD line is above the Signal line, suggesting a bullish momentum.

A recent bullish crossover is evident, indicating strengthening bullish momentum.

No significant divergences noted between MACD and price action.

Volume Analysis

A noticeable spike in volume accompanies the recent upward price movement, indicating strong market interest and supporting the breakout attempt.

The increased volume on upward moves suggests that the price movement is backed by market participation, hinting at potential institutional activity.

The volume spike aligns with a candlestick indicating potential institutional buying or short covering.

Support & Resistance

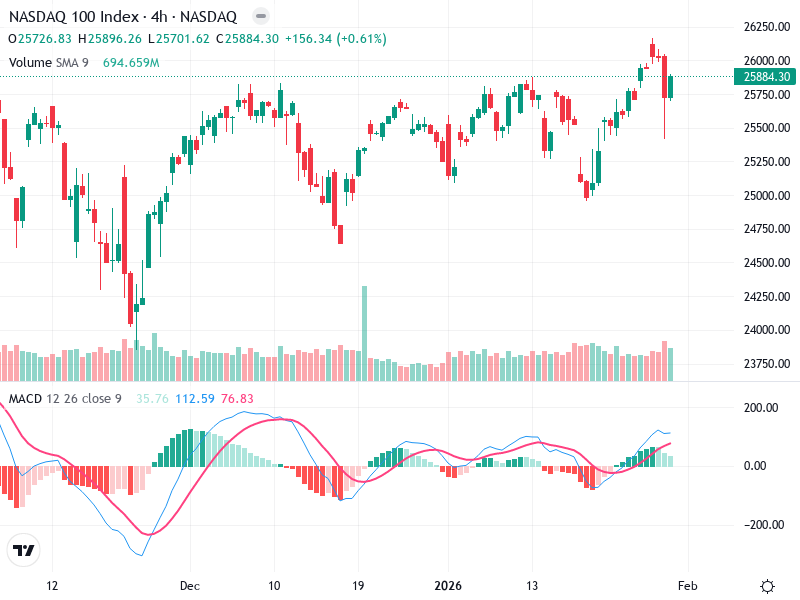
Support is around 25,500, serving as a strong support zone which held during recent dips.

Resistance at approximately 26,000 presents a critical resistance barrier to watch for a breakout.

These levels are pivotal in determining future price action. A break above or below may signal a continuation or reversal.

Actionable Insights

Consider buying on confirmation of sustained move above 26,000 with volume.

Watch for bearish reversal patterns near resistance for potential short-term selling.

Monitor for continuation of bullish momentum backed by sustained volume.

The AI Technical Analysis Center is an informational tool only and does not constitute investment or trading advice.
This site is registered on wpml.org as a development site. Switch to a production site key to remove this banner.