Generic selectors
Exact matches only
Search in title
Search in content
Post Type Selectors

Popular stocks

Crypto

CFD

Currencies

Support

Gold

NSDQ – Technical Analysis – 4h

February 4, 2026 08:01

Quick Summary

The NASDAQ 100 Index 4-hour chart reveals mixed sentiments in the market. While recent bearish momentum was notable, a bullish recovery has been observed, indicating possible reversals or pullbacks. The asset shows varied movement, making it essential to watch for any emerging patterns.

Candlestick Analysis

Recently, a bearish trend was noted with larger red candlesticks, indicating selling pressure.

A recent bullish recovery with green candlesticks suggests a potential reversal or pullback.

No major reversal patterns like bullish engulfing or hammer are clearly visible.

MACD Analysis

The MACD line is below the Signal line after a recent bearish crossover, indicating potential continued downside momentum.

The MACD histogram is currently negative, suggesting bearish momentum, although there is a slight decrease in bearish momentum indicating a potential slowdown in the downward trend.

No clear divergence between the MACD and price action is evident at this point.

Volume Analysis

Volume spiked during recent price declines, validating the downward move as driven by higher selling interest.

The recent increase in volume during declines suggests the presence of strong selling pressure which recently subsided slightly as the price started to climb.

A notable volume spike can be observed around the recent lows, which might indicate some accumulation or institutional activity.

Support & Resistance

Key support is identified around 25,100, which has been recently tested and held.

Resistance is seen around 25,750, where previous price rallies faced selling pressure.

Actionable Insights

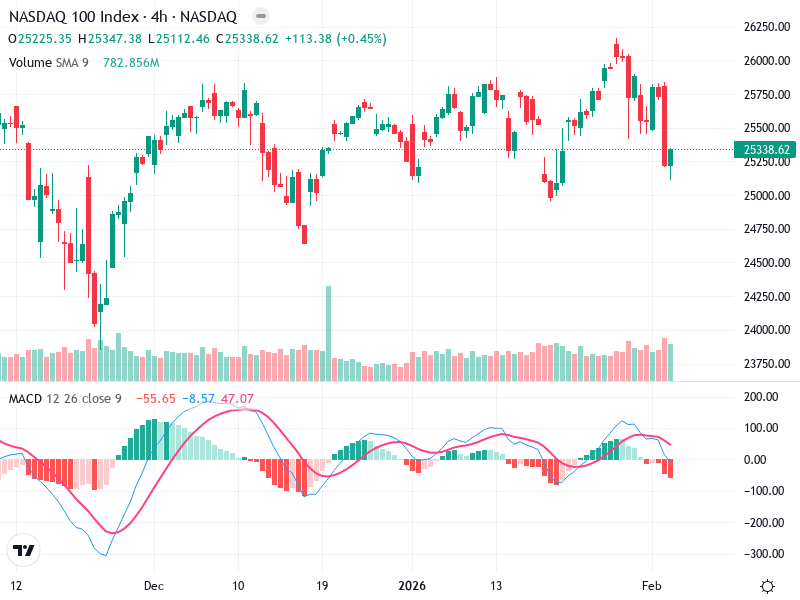
Consider buying near the 25,100 level if supported by a reversal pattern and confirmed by a bullish crossover in MACD.

A move below 25,100 with increased volume could signal further downside, justifying short positions towards previous lows.

If price remains between 25,100 and 25,750, consider holding until a clearer trend emerges.

The AI Technical Analysis Center is an informational tool only and does not constitute investment or trading advice.
This site is registered on wpml.org as a development site. Switch to a production site key to remove this banner.